Fig. A.1
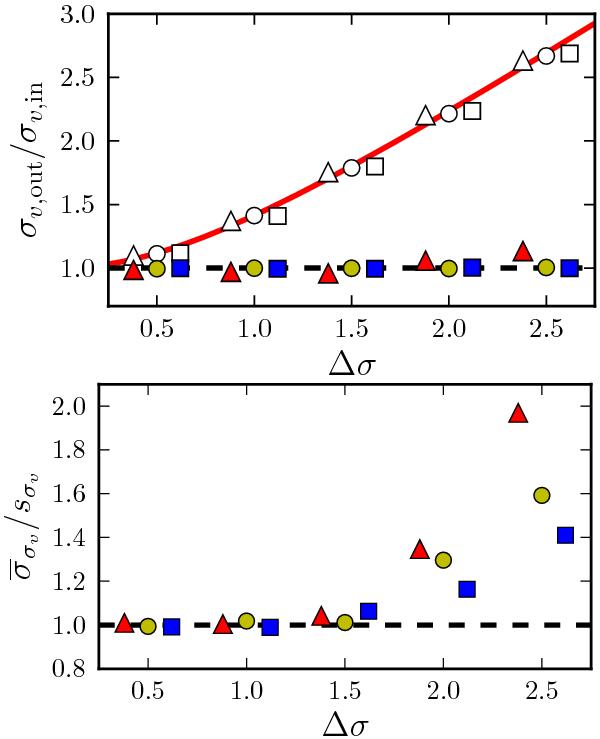
Recovered cosmic variance over input cosmic variance (top panel)
and median σσv
over the dispersion of the recovered cosmic variance (bottom
panel) as a function of Δσ. In both panels, triangles, circles, and
squares are the results from synthetic catalogues with n =
50,250, and 1000, respectively. White symbols
show the results from the BLS fit to the data (σv,BLS), while
those coloured show the ones from the MLE (σv,ML). The
n =
50 and 1000 points are shifted to avoid overlap. The dashed
lines mark identity, and the solid line in the top panel shows
the expectation from a convolution of two Gaussians in log-space,
 .
.
Current usage metrics show cumulative count of Article Views (full-text article views including HTML views, PDF and ePub downloads, according to the available data) and Abstracts Views on Vision4Press platform.
Data correspond to usage on the plateform after 2015. The current usage metrics is available 48-96 hours after online publication and is updated daily on week days.
Initial download of the metrics may take a while.