Fig. 15
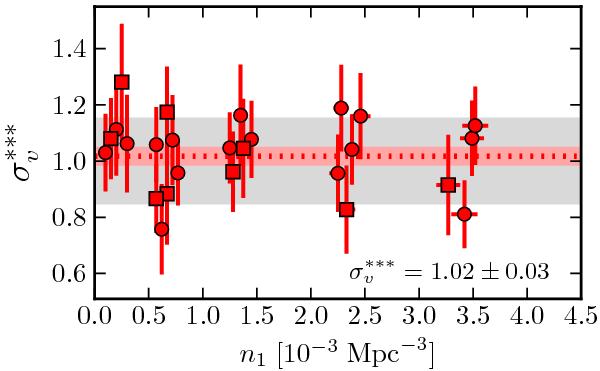
Normalised cosmic variance  as a function of n1 for samples selected in stellar
mass. The dots are those samples without a mass ratio imposed, and the squares are
those with a mass ratio applied (Table 9).
Points at the same number density are offset when needed to avoid overlap. The
dashed line marks the error-weighted average of
,
as a function of n1 for samples selected in stellar
mass. The dots are those samples without a mass ratio imposed, and the squares are
those with a mass ratio applied (Table 9).
Points at the same number density are offset when needed to avoid overlap. The
dashed line marks the error-weighted average of
,
 . The coloured area
shows its 68% confidence interval. The grey area marks the 15% uncertainty expected
from our parametrisation of the cosmic variance. A colour version of this plot is
available in the electronic edition.
. The coloured area
shows its 68% confidence interval. The grey area marks the 15% uncertainty expected
from our parametrisation of the cosmic variance. A colour version of this plot is
available in the electronic edition.
Current usage metrics show cumulative count of Article Views (full-text article views including HTML views, PDF and ePub downloads, according to the available data) and Abstracts Views on Vision4Press platform.
Data correspond to usage on the plateform after 2015. The current usage metrics is available 48-96 hours after online publication and is updated daily on week days.
Initial download of the metrics may take a while.