Fig. 13
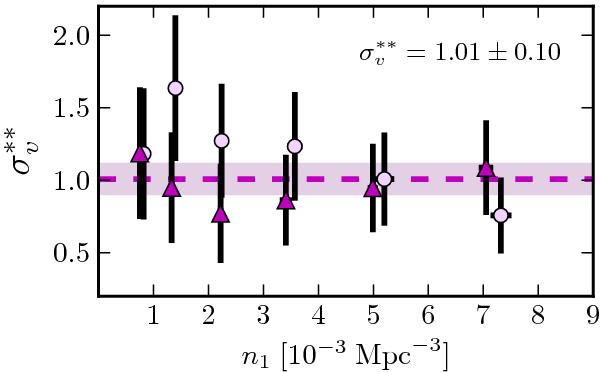
Normalised cosmic variance  as a function of n1 at 0.3 ≤ z<
0.9 for the first (circles) and the second (triangles) group of
seven independent pointings in the ALHAMBRA survey (see text for details). The
dashed line marks the error-weighted average of
,
as a function of n1 at 0.3 ≤ z<
0.9 for the first (circles) and the second (triangles) group of
seven independent pointings in the ALHAMBRA survey (see text for details). The
dashed line marks the error-weighted average of
,
 , and the coloured area
shows its 68% confidence interval. A colour version of this plot is available in the
electronic edition.
, and the coloured area
shows its 68% confidence interval. A colour version of this plot is available in the
electronic edition.
Current usage metrics show cumulative count of Article Views (full-text article views including HTML views, PDF and ePub downloads, according to the available data) and Abstracts Views on Vision4Press platform.
Data correspond to usage on the plateform after 2015. The current usage metrics is available 48-96 hours after online publication and is updated daily on week days.
Initial download of the metrics may take a while.