Fig. 2
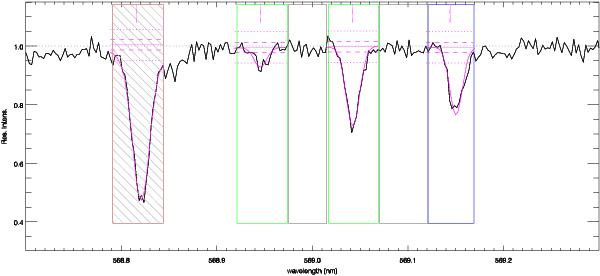
A small section of the S/N = 50 solar spectrum presented in 6.1 with overplotted MyGIsFOS features and fitting result as produced by the ancillary plotting package SQUID. From left to right: a rejected Na i line (rejected due to EW exceeding the applied maximum EW constraint, gray shaded box); a Ti i feature (green box); a continuum interval (gray box); a Si i feature (green box again); another continuum (gray); a Fe i features (blue box). The observed spectrum (black line) appears as renormalized by MyGIsFOS. The gray dashed horizontal line represents the continuum level, each feature is superimposed with the best fit synthetic (magenta), the best fit continuum (magenta continuous horizontal line), 1σ and 3σ values of the noise (horizontal dashed and dotted magenta lines), and markers of best fit doppler shift for the feature (magenta vertical continuous and dashed lines).
Current usage metrics show cumulative count of Article Views (full-text article views including HTML views, PDF and ePub downloads, according to the available data) and Abstracts Views on Vision4Press platform.
Data correspond to usage on the plateform after 2015. The current usage metrics is available 48-96 hours after online publication and is updated daily on week days.
Initial download of the metrics may take a while.