Free Access
Fig. 4
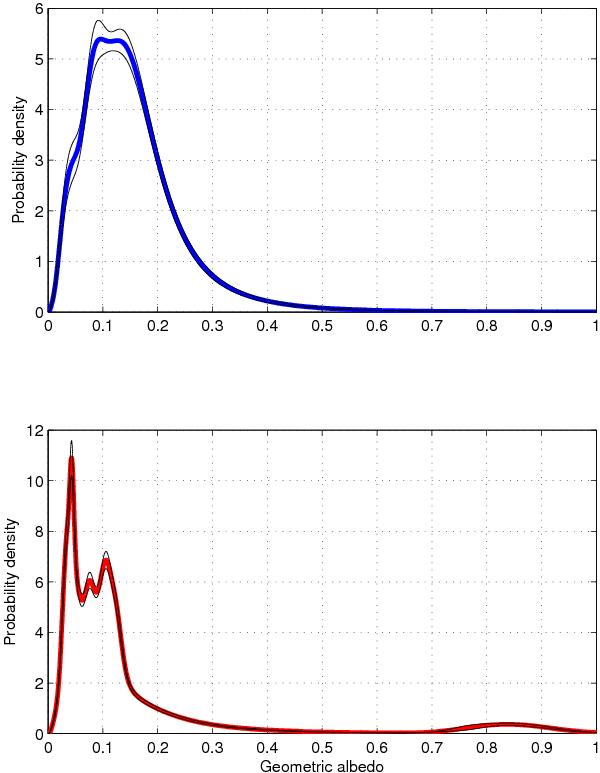
Distribution of measured geometric albedos: upper panel for cold CKBOs and lower panel for hot CKBOs. The thin lines show the standard deviation of all probability density distributions, where each of the distributions has been determined with one target excluded, each target having been excluded once.
Current usage metrics show cumulative count of Article Views (full-text article views including HTML views, PDF and ePub downloads, according to the available data) and Abstracts Views on Vision4Press platform.
Data correspond to usage on the plateform after 2015. The current usage metrics is available 48-96 hours after online publication and is updated daily on week days.
Initial download of the metrics may take a while.