Fig. 3
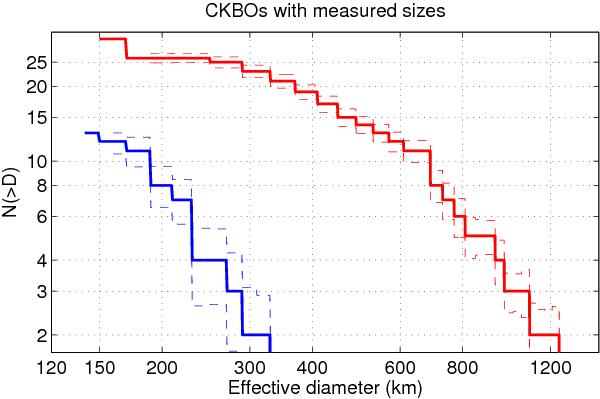
Cumulative size distribution of all measured dynamically hot (red, upper) classicals from Table 7 and dynamically cold (blue, lower) classicals from Table 6. The dotted lines are uncertainties obtained by a Monte Carlo technique where the sizes of targets are varied using their measured error bars, and a set of size distributions is created. The standard deviation of these size distributions is calculated at each size bin.
Current usage metrics show cumulative count of Article Views (full-text article views including HTML views, PDF and ePub downloads, according to the available data) and Abstracts Views on Vision4Press platform.
Data correspond to usage on the plateform after 2015. The current usage metrics is available 48-96 hours after online publication and is updated daily on week days.
Initial download of the metrics may take a while.