Fig. 1
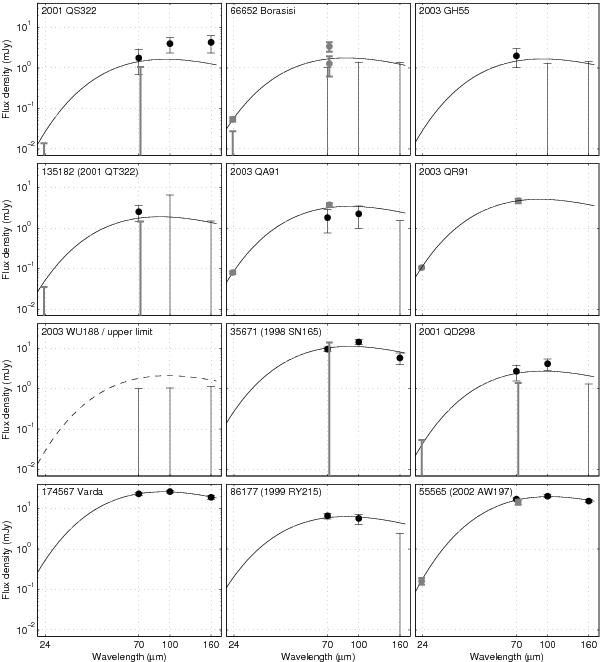
SEDs calculated from the model solutions (Table 5). The black data points are from PACS (70, 100 and 160 μm) and the gray points are from MIPS (23.68 and 71.42 μm) normalized to the observing geometry of PACS. Error bars without a data point indicate 1σ upper limits. An upper-limit solution based on a non-detection is marked with a dashed line (see text). Target 2003 QR91 was not observed by PACS.
Current usage metrics show cumulative count of Article Views (full-text article views including HTML views, PDF and ePub downloads, according to the available data) and Abstracts Views on Vision4Press platform.
Data correspond to usage on the plateform after 2015. The current usage metrics is available 48-96 hours after online publication and is updated daily on week days.
Initial download of the metrics may take a while.