Fig. 7
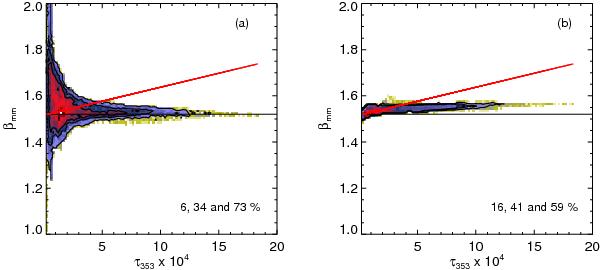
Dust opacity index βmm recovered from the simulated maps, as a function of the input τ353. The simulated maps in a) have dust emission and CMB, and in b) consist of dust, free-free and CO emission. The black line shows the input βmm of 1.52 in each case; the red lines give the βmm–τ353 relationship derived in Sect. 5. The colour scale is logarithmic and it represents the density of points. The three contours show the densities for the cumulated fractions, given by the values in each panel, of the data points, from red to yellow.
Current usage metrics show cumulative count of Article Views (full-text article views including HTML views, PDF and ePub downloads, according to the available data) and Abstracts Views on Vision4Press platform.
Data correspond to usage on the plateform after 2015. The current usage metrics is available 48-96 hours after online publication and is updated daily on week days.
Initial download of the metrics may take a while.