Fig. A.2
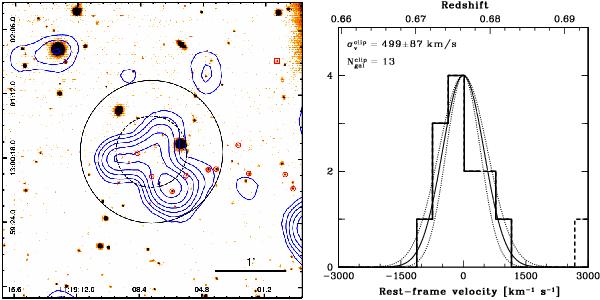
Left: a 4′ × 4′ wide z-band image of cluster XDCP J1119.1+1300 – cl02 at z = 0.6764. Symbols and colors have the same meaning as in Fig. A.1. Red squares mark those galaxies excluded from the analysis because their measured redshift is uncertain or because they are rejected by the σ-clipping procedure described in the text. Right: rest-frame velocity histogram of the cluster galaxies. Here the dashed histograms refer to those galaxies with peculiar velocities | v | < 3000 km s-1 from zcl but which are discarded as members by the iterative 3σ clipping process as described in Sect. 3.3.2.
Current usage metrics show cumulative count of Article Views (full-text article views including HTML views, PDF and ePub downloads, according to the available data) and Abstracts Views on Vision4Press platform.
Data correspond to usage on the plateform after 2015. The current usage metrics is available 48-96 hours after online publication and is updated daily on week days.
Initial download of the metrics may take a while.