Free Access
Fig. 6
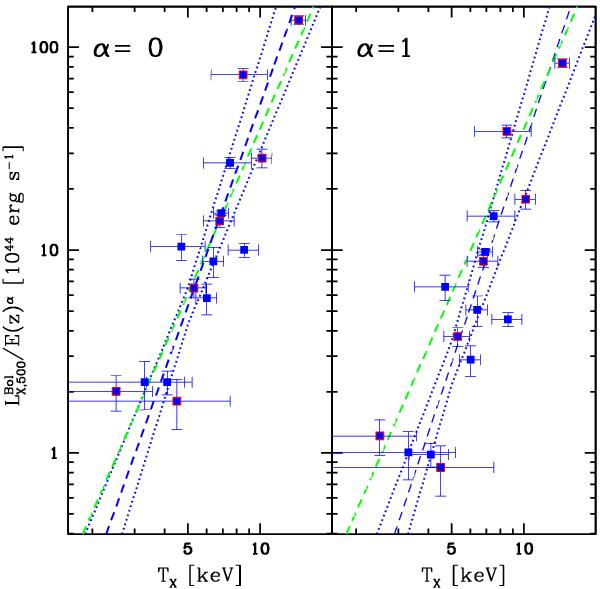
LX − TX relation found for the distant sample of literature clusters. In green, the empirical relation of Pratt et al. (2009) is shown. The symbols used are similar in meaning as that as of Fig. 3.
Current usage metrics show cumulative count of Article Views (full-text article views including HTML views, PDF and ePub downloads, according to the available data) and Abstracts Views on Vision4Press platform.
Data correspond to usage on the plateform after 2015. The current usage metrics is available 48-96 hours after online publication and is updated daily on week days.
Initial download of the metrics may take a while.