Fig. 4

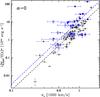
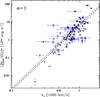
 with the same convention of Fig. 3. The black triangles represent the HIFLUGCS sample with filled symbols referring to those objects in the common luminosity range
  erg s-1 that yeld a best fit relation with a slope of B = 3.58 (black, dashed line). The best fit of the distant sample assuming the above slope is represented by the blue, dashed line, and the 1σ error is not shown for clarity.
Current usage metrics show cumulative count of Article Views (full-text article views including HTML views, PDF and ePub downloads, according to the available data) and Abstracts Views on Vision4Press platform.
Data correspond to usage on the plateform after 2015. The current usage metrics is available 48-96 hours after online publication and is updated daily on week days.
Initial download of the metrics may take a while.