Fig. B.1
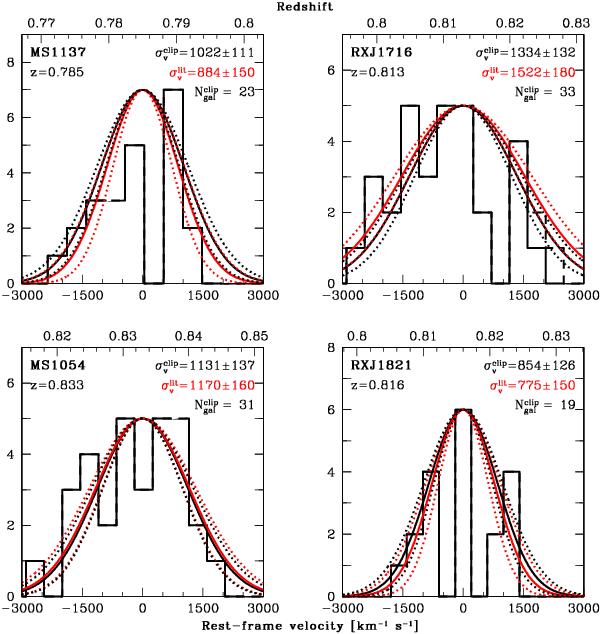
Rest-frame velocity histograms of the “literature sample” clusters with a public redshift set. In addition to the same details presented in Appendix A, we also report here the public value of  (and its uncertainty) for each cluster as listed in Table 1, and we show them with red Gaussian curves. Although our analysis sometimes produced slightly different values of zcl with respect to the ones stated by the authors, such differences are always limited to c·Δzcl/(1 + zcl) ≲ 100 km s-1 and hence the two Gaussian curves of each cluster show the same central values. Our estimates of σv agree with within the errors albeit sometimes the distributions are far from being Gaussian, especially for those systems experiencing major merging events (see e.g. SpARCS0035).
Current usage metrics show cumulative count of Article Views (full-text article views including HTML views, PDF and ePub downloads, according to the available data) and Abstracts Views on Vision4Press platform.
Data correspond to usage on the plateform after 2015. The current usage metrics is available 48-96 hours after online publication and is updated daily on week days.
Initial download of the metrics may take a while.