Fig. 8
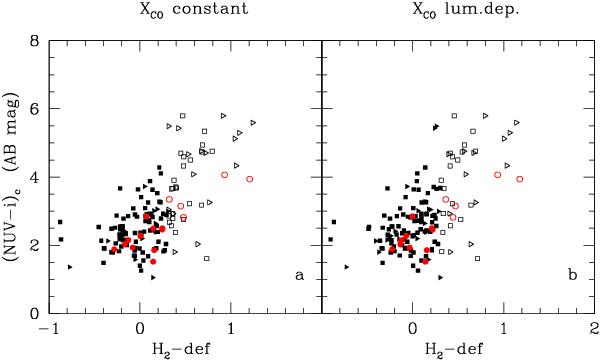
NUV-i vs. H2-deficiency relation for the whole HRS galaxy sample. NUV-i colours (in AB system) are corrected for Galactic and internal dust attenuation following Hao et al. (2011). Galaxies are coded according to their H2-deficiency parameter, where the H2 − def has been measured using a constant (panel a)) or a luminosity-dependent (panel b)) XCO conversion factor. Black squares indicate spiral galaxies whose molecular gas content has been determined using aperture corrections, red dots those objects with available CO integrated maps from Kuno et al. (2007). Filled symbols are for galaxies with H2 − def ≤ 0.3, open symbols for objects with H2 − def > 0.3. For the black squares, the H2-deficiency parameter has been determined using the M(H2) vs. Mstar calibration based on all galaxies (lines 3 and 4 in Table 2), for the red symbols the calibration done on the subsample of galaxies with mapped observations from Kuno et al. (2007) (lines 5 and 6 in Table 2).
Current usage metrics show cumulative count of Article Views (full-text article views including HTML views, PDF and ePub downloads, according to the available data) and Abstracts Views on Vision4Press platform.
Data correspond to usage on the plateform after 2015. The current usage metrics is available 48-96 hours after online publication and is updated daily on week days.
Initial download of the metrics may take a while.