Fig. 2
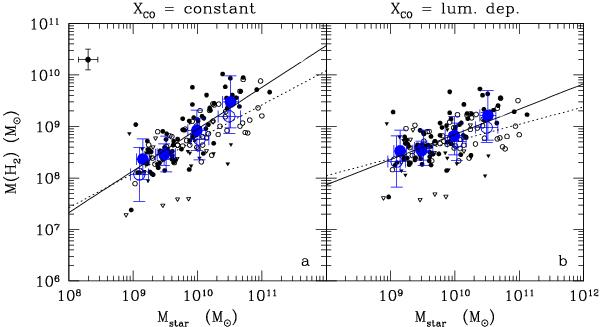
Relationship between molecular gas and stellar mass (in solar units) when the molecular gas mass is determined assuming a constant XCO factor (a), left) or the luminosity-dependent XCO factor given in Boselli et al. (2002) (b), right). Symbols are as in Fig. 1, with in addition big blue empty circles indicating mean values and standard deviations for Hi-deficient objects. The black solid line indicates the linear fit determined using all gas-rich galaxies, while the black dotted line that determined for Hi-deficient objects (black empty symbols).
Current usage metrics show cumulative count of Article Views (full-text article views including HTML views, PDF and ePub downloads, according to the available data) and Abstracts Views on Vision4Press platform.
Data correspond to usage on the plateform after 2015. The current usage metrics is available 48-96 hours after online publication and is updated daily on week days.
Initial download of the metrics may take a while.