Fig. 9
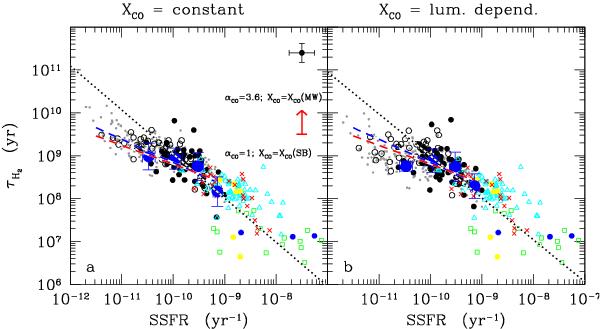
Relationship between molecular gas depletion timescale and the specific star formation rate for HRS galaxies (black symbols), COLD GASS galaxies (grey symbols), and high-redshift objects, from Tacconi et al. (2008) (yellow filled dots), Daddi et al. (2009a,b) (blue filled dots), Genzel et al. (2010) (red crosses), Combes et al. (2013) (green open squares), and Tacconi et al. (2013) (cyan open triangles). The molecular gas content of all high-z galaxies regardless of whether they are star-forming or starburst galaxies, has been determined using a starburst conversion factor XCO = 0.64 × 1020 cm-2 (K km s-1)-1 In the left panel the H2 gas mass of HRS and COLD GASS galaxies is measured using a constant XCO conversion factor, and in the right panel the luminosity-dependent XCO factor of Boselli et al. (2002). Both the local (HRS and COLD GASS) and the high-z samples include only detected late-type galaxies. The big blue circles indicate the mean values of τH2 in different bins of SSFR determined from the HRS sample. The black dotted line shows the best fit determined for HRS galaxies, the coloured lines the best fits for the COLD GASS sample. The red vertical arrow indicate the systematic shift that all high-redshift galaxies would have if the molecular gas mass is determined assuming a Galactic conversion factor.
Current usage metrics show cumulative count of Article Views (full-text article views including HTML views, PDF and ePub downloads, according to the available data) and Abstracts Views on Vision4Press platform.
Data correspond to usage on the plateform after 2015. The current usage metrics is available 48-96 hours after online publication and is updated daily on week days.
Initial download of the metrics may take a while.