Fig. 5
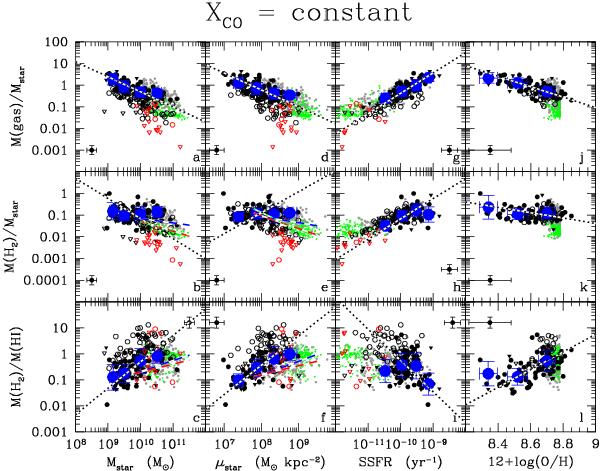
Scaling relation concerning the total gas-to-stellar mass ratio (upper rows), the molecular gas-to-stellar mass ratio (middle rows) and the molecular-to-atomic gas ratio (lower rows). These entities are plotted vs. the total stellar mass (left panels), the stellar surface density (middle-left panels), the specific star formation rate (middle-right panels), and the metallicity (right panels). Molecular gas masses are determined assuming a constant (XCO = 2.3 × 1020 cm-2/(K km s-1)) conversion factor. Circles indicate detected galaxies, triangles upper limits. Black symbols are for late-type, red symbols for early-type HRS galaxies, grey symbols for detected and green symbols for undetected (upper limits) COLD GASS objects (these last corrected for the same conversion factor). For the HRS, filled symbols indicate late-type galaxies with a normal Hi gas content (Hi − def < 0.4), empty symbols Hi-deficient objects (Hi − def ≥ 0.4). The big blue symbols give the mean values and the standard deviation (in log scale) considering only Hi and CO detected late-type objects. The typical error bars on the data are given in each panel. These are errors on the total CO flux and do not include any other error in the transformation of the CO fluxes into molecular gas masses. The black dotted line indicates the bisector fit determined using only detected, late-type gas-rich galaxies (Hi − def < 0.4; black filled dots). The blue dashed, red dashed, and green dotted lines show the best fit obtained by Saintonge et al. (2011a) for the COLD GASS sample when considering only CO detections (blue), CO upper limits as detections (red), and CO undetections as zero values (green).
Current usage metrics show cumulative count of Article Views (full-text article views including HTML views, PDF and ePub downloads, according to the available data) and Abstracts Views on Vision4Press platform.
Data correspond to usage on the plateform after 2015. The current usage metrics is available 48-96 hours after online publication and is updated daily on week days.
Initial download of the metrics may take a while.