Fig. 4
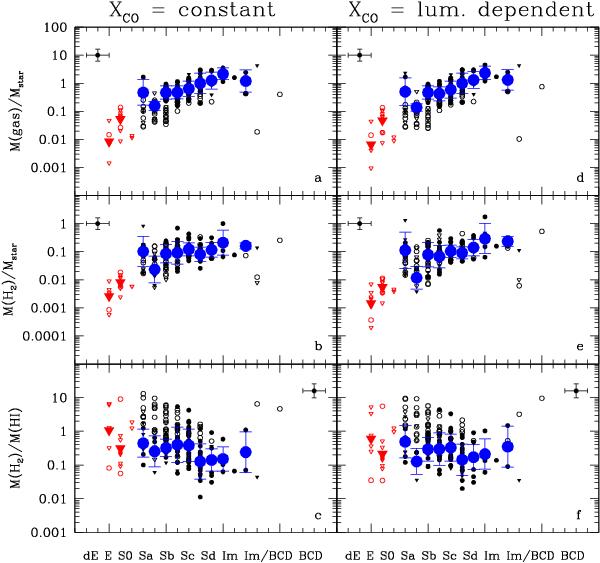
Relationship between the total gas-to-stellar mass (panels a), d)), the molecular-to-stellar mass (panels b), e)), and the molecular-to-atomic gas ratios (panels c), f)) and morphological type. The molecular gas mass is determined using a constant (XCO = 2.3 × 1020 cm-2/(K km s-1); left panels) or the H-band luminosity dependent (right panels) conversion factor of Boselli et al. (2002). Circles indicate detected galaxies, triangles upper limits. Black symbols are for late-type, red symbols for early-type HRS galaxies. For late-type systems, filled symbols indicate galaxies with a normal Hi gas content (Hi − def < 0.4), empty symbols Hi-deficient objects (Hi − def ≥ 0.4). The big symbols give the mean values and the standard deviation (in log scale) in each bin of morphological type considering only Hi detected objects with Hi − def ≤ 0.4 and CO upper limits as detections. The typical error bar on the data is given in each panel.
Current usage metrics show cumulative count of Article Views (full-text article views including HTML views, PDF and ePub downloads, according to the available data) and Abstracts Views on Vision4Press platform.
Data correspond to usage on the plateform after 2015. The current usage metrics is available 48-96 hours after online publication and is updated daily on week days.
Initial download of the metrics may take a while.