Fig. 3
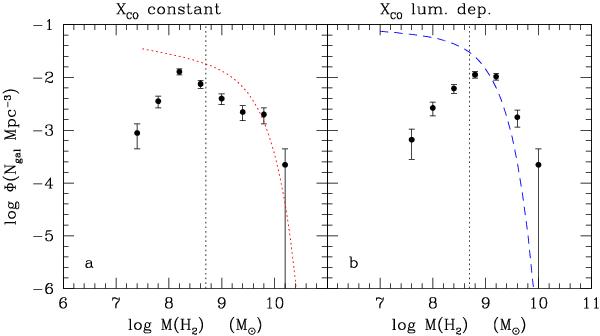
Molecular hydrogen mass distribution of the HRS galaxies in bins of 0.4 in log. The molecular gas mass is determined assuming a constant XCO factor (left panel) or the luminosity dependent XCO factor given in Boselli et al. (2002) (right panel). The distribution is compared to the one derived by Oberschkow & Rawlings (2009) from the CO luminosity distribution of Keres et al. (2003) assuming a constant (red dotted line) or a luminosity dependent (blue dashed line) XCO conversion factor. The vertical black dotted line indicates the completeness in M(H2) of the HRS sample.
Current usage metrics show cumulative count of Article Views (full-text article views including HTML views, PDF and ePub downloads, according to the available data) and Abstracts Views on Vision4Press platform.
Data correspond to usage on the plateform after 2015. The current usage metrics is available 48-96 hours after online publication and is updated daily on week days.
Initial download of the metrics may take a while.