Free Access
Fig. 1
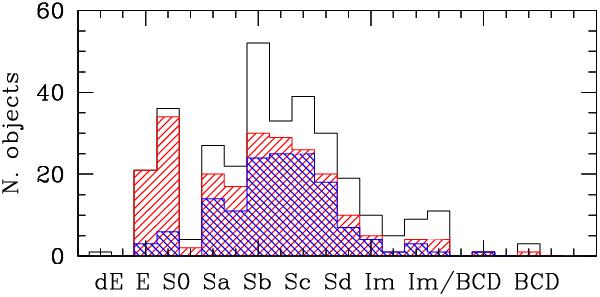
Distribution in morphological type of all the HRS galaxies (black solid line) and of those objects with available CO data (red shaded histogram). Galaxies detected in CO are represented by the blue shaded histogram.
Current usage metrics show cumulative count of Article Views (full-text article views including HTML views, PDF and ePub downloads, according to the available data) and Abstracts Views on Vision4Press platform.
Data correspond to usage on the plateform after 2015. The current usage metrics is available 48-96 hours after online publication and is updated daily on week days.
Initial download of the metrics may take a while.