Fig. 9
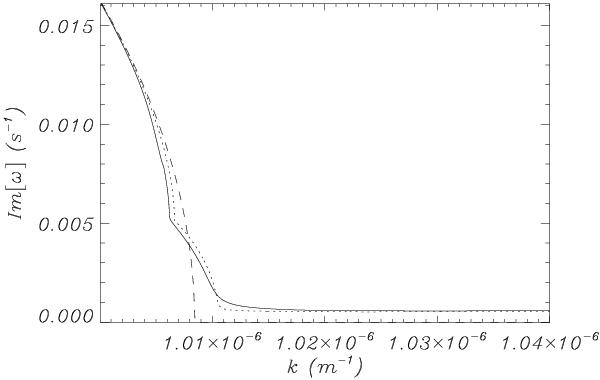
Linear growth rate of the RTI as a function of the wavenumber. The values chosen for the plot are ρ2 = 10-10 kg m-3, ρ2/ρ1 = 100, θ = 85° m-1, B0 = 10 G, cs2 = 15 km s-1, ξ2 = 0.5, and ξ1 = 0.1. The dashed line is the incompressible MHD limit from Eq. (1); the dotted line corresponds to the PI one-fluid model with only the ambipolar term (Sect. 4); and the solid line to the PI one-fluid model with all the terms in the induction equation.
Current usage metrics show cumulative count of Article Views (full-text article views including HTML views, PDF and ePub downloads, according to the available data) and Abstracts Views on Vision4Press platform.
Data correspond to usage on the plateform after 2015. The current usage metrics is available 48-96 hours after online publication and is updated daily on week days.
Initial download of the metrics may take a while.