Fig. 3
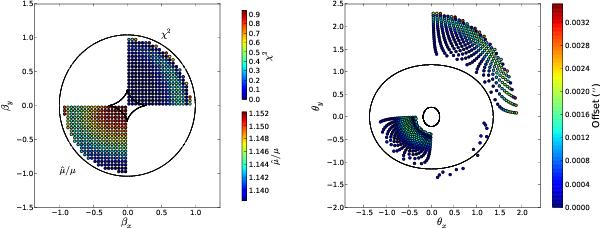
Right: set of mock lensed images produced by our fiducial lens model (using a grid of source positions shown in the first quadrant of the left panel). The color-coding shows the offset in arcseconds, between the original image positions and those found with the power-law model. Left: first quadrant (upper right): grid of source positions lensed with our fiducial model to produce the images shown in the right panel. The color-coding indicates the χ2 associated with each source, assuming an astrometric uncertainty on the image position of σθx,y = 0.004′′. In the third quadrant (lower left), the sources do not have corresponding lensed images on the right panel, and are colored as a function of the ratio of their total magnification as derived with the power-law and the fiducial models (i.e.,  ).
).
Current usage metrics show cumulative count of Article Views (full-text article views including HTML views, PDF and ePub downloads, according to the available data) and Abstracts Views on Vision4Press platform.
Data correspond to usage on the plateform after 2015. The current usage metrics is available 48-96 hours after online publication and is updated daily on week days.
Initial download of the metrics may take a while.