Fig. 11

Top: temperature profile in the cloud. The dotted profile is without turbulence, and the plain profile with a turbulent velocity of 30 km s-1. The first vertical gray band indicates the transition into the molecular cloud (H2>H i), and the second gray band when CO starts to form. Bottom: cloudy model predictions for the CO(3–2)/CO(2–1) ratio as a function of turbulent velocity. The two cases of constant density (open symbols) and constant pressure (filled symbols) are considered. The horizontal dotted line indicates the observed CO ratio and the vertical dashed line the observed CO velocity 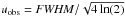 . Triangles correspond to the model without turbulent velocity.


Current usage metrics show cumulative count of Article Views (full-text article views including HTML views, PDF and ePub downloads, according to the available data) and Abstracts Views on Vision4Press platform.
Data correspond to usage on the plateform after 2015. The current usage metrics is available 48-96 hours after online publication and is updated daily on week days.
Initial download of the metrics may take a while.