Free Access
Fig. 8
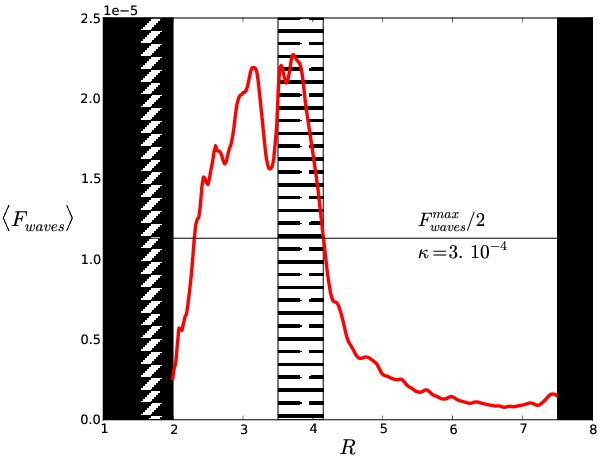
Turbulent thermal flux profile averaged over 200 inner orbits after t = 900 + τcool(R = 7) from the σhot run. The central dotted region locates the percolation region behind active/dead zone interface.
Current usage metrics show cumulative count of Article Views (full-text article views including HTML views, PDF and ePub downloads, according to the available data) and Abstracts Views on Vision4Press platform.
Data correspond to usage on the plateform after 2015. The current usage metrics is available 48-96 hours after online publication and is updated daily on week days.
Initial download of the metrics may take a while.