Free Access
Fig. 6
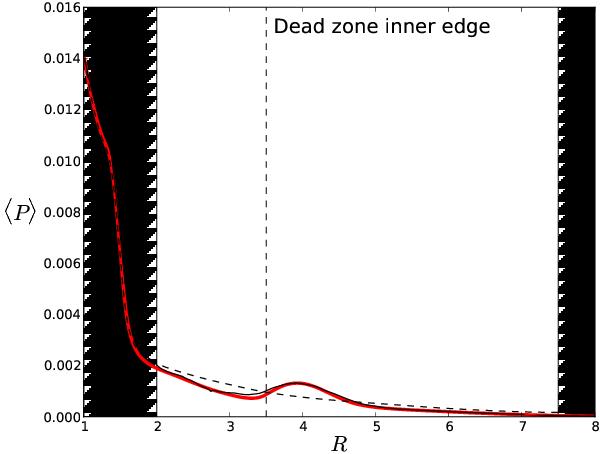
Pressure profile averaged over 200 orbits after t = 900 + τcool(R = 7) in σHot case. The black solid line show the pressure profile 200 inner orbits after freezing the temperature in the domain. The black dashed line plots the radial temperature profile in the ideal case (i.e. without a dead zone).
Current usage metrics show cumulative count of Article Views (full-text article views including HTML views, PDF and ePub downloads, according to the available data) and Abstracts Views on Vision4Press platform.
Data correspond to usage on the plateform after 2015. The current usage metrics is available 48-96 hours after online publication and is updated daily on week days.
Initial download of the metrics may take a while.