Free Access
Fig. 3
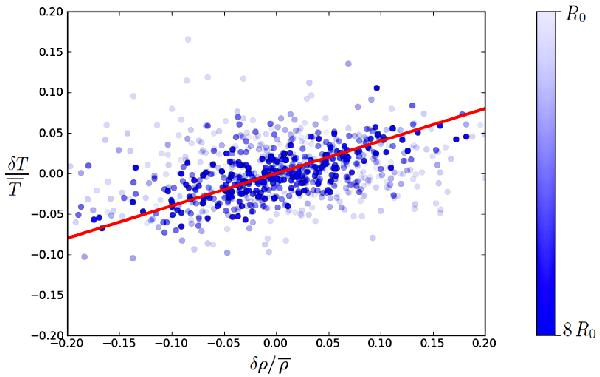
Blue dots map the scaling relation between temperature and density fluctuations δT and δρ in the σhot simulation. 900 events are randomly selected in the whole domain (except buffer zones) among 900 inner orbits. The red line shows the linear function (slope = γ − 1)) corresponding to the adiabatic scaling.
Current usage metrics show cumulative count of Article Views (full-text article views including HTML views, PDF and ePub downloads, according to the available data) and Abstracts Views on Vision4Press platform.
Data correspond to usage on the plateform after 2015. The current usage metrics is available 48-96 hours after online publication and is updated daily on week days.
Initial download of the metrics may take a while.