Fig. C.1
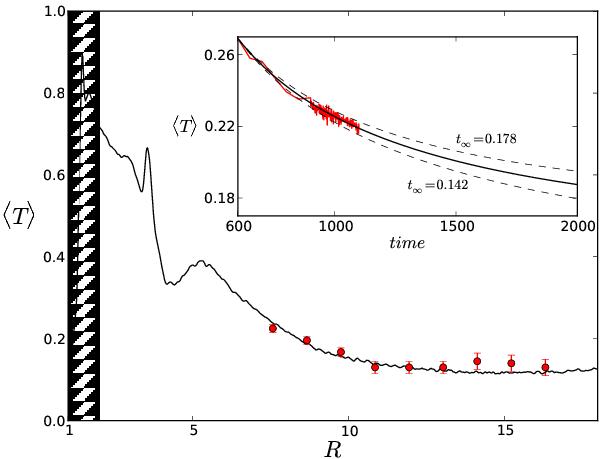
Temperature profile ⟨ T ⟩ averaged over 200 orbits after t = 900 + τcool(R = 7) obtained in the extended σhot case. The black line show wave-equilibrium temperature profile. Red dots show the extrapolated temperature for 7 radii. The inserted frame show in red the temperature evolution  after t = 900 at R = 9.8R0 in the extended σhot simulation. On this subplot, the black plain line shows the accurate fit and the black dashed lines show the two extreme fits used to determine the measurement error.
Current usage metrics show cumulative count of Article Views (full-text article views including HTML views, PDF and ePub downloads, according to the available data) and Abstracts Views on Vision4Press platform.
Data correspond to usage on the plateform after 2015. The current usage metrics is available 48-96 hours after online publication and is updated daily on week days.
Initial download of the metrics may take a while.