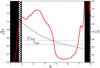
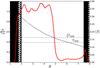
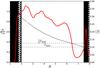
Fig. 11
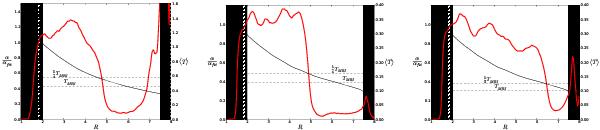
α profiles averaged over 100 orbits after the fronts have reached their final position (α values are listed on the left axis). Left panel: σhot simulation which TMRI = 0.46. Middle and right panels: σcold simulation which TMRI = 0.1 and TMRI = 0.13 respectively. The black plain lines remind the temperature profiles from ideal cases. Black dashed lines show the threshold value TMRI and 5/4TMRI. The temperature values are listed on the right axis.
Current usage metrics show cumulative count of Article Views (full-text article views including HTML views, PDF and ePub downloads, according to the available data) and Abstracts Views on Vision4Press platform.
Data correspond to usage on the plateform after 2015. The current usage metrics is available 48-96 hours after online publication and is updated daily on week days.
Initial download of the metrics may take a while.