Fig. 10
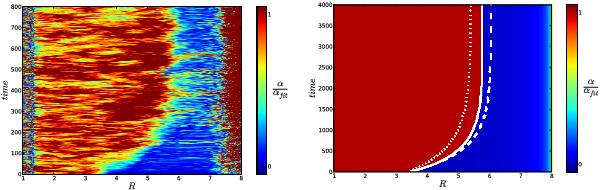
Space-time diagrams showing the turbulent activity evolution in the MHD simulation (left panel) and in the mean field model (right panel). In the case of the MHD simulation, α is averaged over Z and φ. In the case of the mean field model, the different white lines mark the front position for the additional models described in Sect. 4.3. The solid line represents the case of remnant heating in the dead zone, the dashed line no remnant heating, and the dotted line the case of constant thermal diffusivity over the whole domain. Note the different vertical scales of the two panels (see discussion in the text for its origin).
Current usage metrics show cumulative count of Article Views (full-text article views including HTML views, PDF and ePub downloads, according to the available data) and Abstracts Views on Vision4Press platform.
Data correspond to usage on the plateform after 2015. The current usage metrics is available 48-96 hours after online publication and is updated daily on week days.
Initial download of the metrics may take a while.