Fig. 1
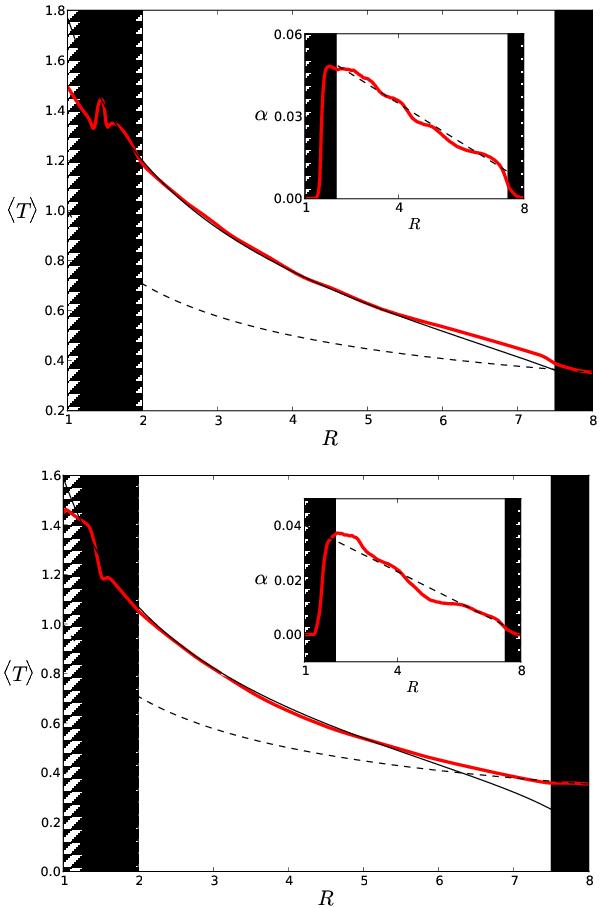
Temperature profiles ⟨ T ⟩ averaged over 900 inner orbits (red curves). Black plain lines show their corresponding theoretical profiles. Black dashed lines show their corresponding initial profiles. Top panel: σcold case. Bottom panel: σhot case. The subframes inserted in the upper right of each panel show the alpha profiles obtained in both cases (red lines). The dashed lines show the analytic profiles used to compute the theoretical temperature profile (see text), given by α = 6.3 × 10⁻² − 7.1 × 10⁻³R/R0 and α = 4.6 × 10⁻² − 5.7 × 10⁻³R/R0 respectively.
Current usage metrics show cumulative count of Article Views (full-text article views including HTML views, PDF and ePub downloads, according to the available data) and Abstracts Views on Vision4Press platform.
Data correspond to usage on the plateform after 2015. The current usage metrics is available 48-96 hours after online publication and is updated daily on week days.
Initial download of the metrics may take a while.