Fig. 1
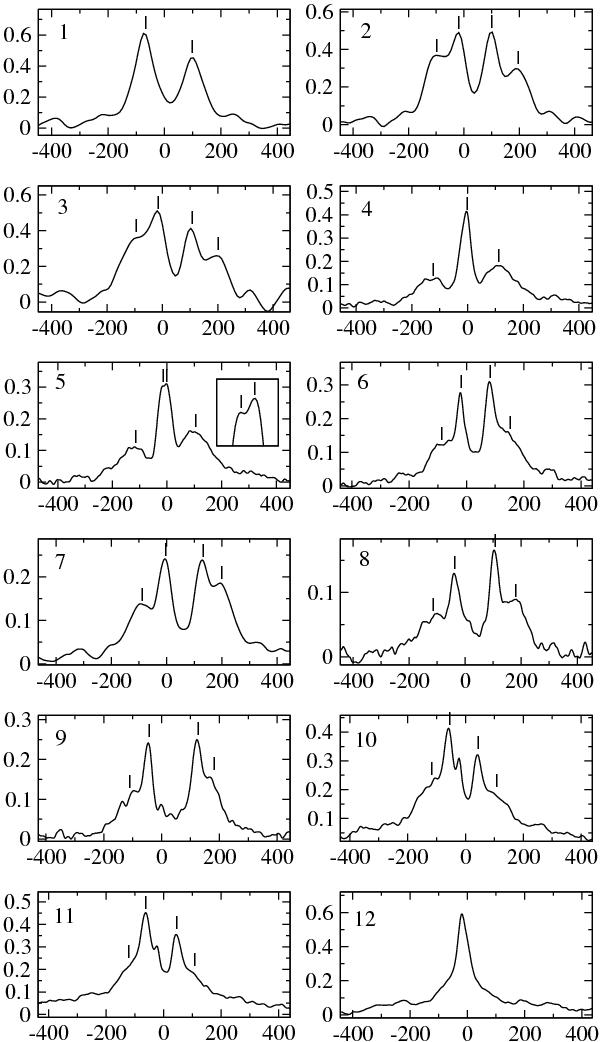
Cross correlation function for all spectra listed in Table 1. Numbers of the plots correspond to the Table 1 order, x-axis represents the observed velocities, and y-axis the correlation coefficient. The measured velocities are marked. Additionally, one CCF plot (12) is presented with all four peaks blended. First three plots are from the Rozhen spectra, the rest are from PST 1.
Current usage metrics show cumulative count of Article Views (full-text article views including HTML views, PDF and ePub downloads, according to the available data) and Abstracts Views on Vision4Press platform.
Data correspond to usage on the plateform after 2015. The current usage metrics is available 48-96 hours after online publication and is updated daily on week days.
Initial download of the metrics may take a while.