Fig. 2
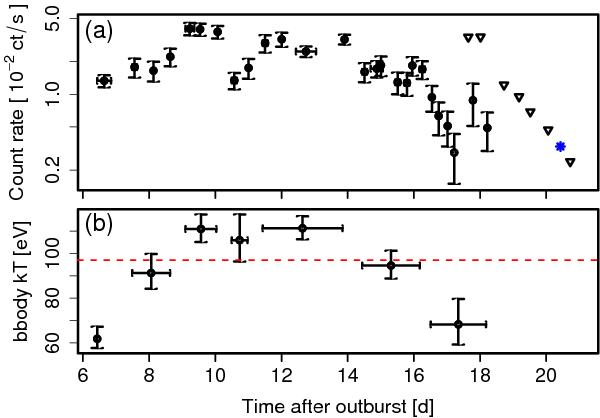
Evolution of X-ray count rate a) and effective black-body temperature b) of M31N 2008-12a during the 2013 Swift monitoring. This assumes an outburst on November 26.6, 2013 UT (see also Table 1). The error bars in time represent the duration of the individual observation a) or the time between the grouped observations b). Panel a) Upper limits are indicated by black open triangles. A blue asterisk marks the first upper limit estimated from the Swift monitoring after the 2012 outburst (see Table 2). Panel b) Groups of observations have been fitted simultaneously with the NH fixed to the global best fit. The red dashed line shows the overall best-fit temperature derived in Sect. 3.
Current usage metrics show cumulative count of Article Views (full-text article views including HTML views, PDF and ePub downloads, according to the available data) and Abstracts Views on Vision4Press platform.
Data correspond to usage on the plateform after 2015. The current usage metrics is available 48-96 hours after online publication and is updated daily on week days.
Initial download of the metrics may take a while.