| Issue |
A&A
Volume 563, March 2014
|
|
|---|---|---|
| Article Number | A50 | |
| Number of page(s) | 12 | |
| Section | Stellar structure and evolution | |
| DOI | https://doi.org/10.1051/0004-6361/201423380 | |
| Published online | 06 March 2014 | |
XMM-Newton reveals a candidate period for the spin of the “Magnificent Seven” neutron star RX J1605.3+3249⋆
1 Leibniz-Institut für Astrophysik Potsdam (AIP), An der Sternwarte 16, 14482 Potsdam, Germany
e-mail: This email address is being protected from spambots. You need JavaScript enabled to view it.
2 Max-Planck-Institut für extraterrestrische Physik, Giessenbachstraße, 85748 Garching, Germany
3 NASA Marshall Space Flight Center, Universities Space Research Association, VP62, Huntsville AL 35812, USA
4 CNRS, Université de Strasbourg, Observatoire Astronomique, 11 rue de l’Université, 67000 Strasbourg, France
5 Mullard Space Science Laboratory, University College London, Holmbury St. Mary, Dorking, Surrey, RH5 6NT, UK
6 Astrophysikalisches Institut und Universitäts-Sternwarte Jena, Schillergässchen 2-3, 07745 Jena, Germany
Received: 7 January 2014
Accepted: 28 January 2014
Abstract
Context. The group of seven thermally emitting isolated neutron stars (INSs) discovered by ROSAT and known as the “Magnificent Seven” (M7) is unique among the various neutron star populations. Crustal heating by means of magnetic field decay and an evolutionary link with magnetars may explain why these objects rotate more slowly and have higher thermal luminosities and magnetic field intensities than standard rotation-powered pulsars of similar age.
Aims. The third brightest INS, RX J1605.3+3249, is the only object amidst the seven still lacking a detected periodicity. The source spectrum, while purely thermal with no significant magnetospheric emission, is complex and displays both narrow and broad absorption features that can potentially be used to constrain the surface component of the magnetic field, as well as the mass-to-radius ratio of the neutron star.
Methods. We observed the source with the XMM-Newton Observatory for 60 ks aiming at unveiling the neutron star rotation rate and investigating its spectrum in detail. We confront our results with previous observations of the source and discuss its properties in the context of the M7 as a group and of the known population of Galactic INSs.
Results. A periodic signal at P = 3.387864(16) s, most likely the neutron star spin period, is detected at the 4σ confidence level. The amplitude of the modulation was found to be energy dependent and is more significantly detected when the timing search is restricted to photons with energy higher than ~0.5 keV. The coherent combination of the new data with a past XMM-Newton EPIC-pn observation of the source constrains the pulsar spin-down rate at the 2σ confidence level,  Hz s-1, implying a dipolar magnetic field of Bdip ~ 7.4 × 10¹³ G. If confirmed, RX J1605.3+3249 would be the neutron star with the highest dipolar field amongst the M7. The spectrum of the source shows evidence of a cool blackbody component, as well as for the presence of two broad absorption features. Furthermore, high-resolution spectroscopy with the RGS cameras confirms the presence of a narrow absorption feature at energy ~0.57 keV in the co-added spectrum of the source, also seen in other thermally emitting isolated neutron stars.
Conclusions. Phase-resolved spectroscopy, as well as a dedicated observing campaign aimed at determining a timing solution, will give invaluable constraints on the neutron star geometry and will allow one to confirm the high value of spin down, which would place the source closer to a magnetar than any other M7 INS.
Key words: X-rays: individuals: RX J1605.3+3249 / stars: neutron / pulsars: general
Based on observations obtained with XMM-Newton, an ESA science mission with instruments and contributions directly funded by ESA Member States and NASA (Target RX J1605.3+3249, obsid 0671620101).
© ESO, 2014
1. Introduction
Forty-five years after the discovery of PSR B1919+21 (Hewish et al. 1968), pulsars detected in radio surveys still dominate neutron star statistics (Manchester et al. 2005). Interestingly, it is at high energies that the neutron star phenomenology is revealed in all its complexity, with the discovery of peculiar classes of isolated neutron stars (INSs) not detected in the radio regime (see Kaspi 2010; Mereghetti 2011; Harding 2013, for an overview). These include most of the magnetars – anomalous X-ray pulsars (AXPs) and soft gamma repeaters (SGRs) – the central compact objects (CCOs) in supernova remnants and the ROSAT-discovered thermally emitting INSs, also known as the “Magnificent Seven” (M7).
In particular, the M7 is a remarkable group of INSs (Haberl 2007; Kaplan 2008; Turolla 2009, for reviews). As likely products of the nearby OB associations of the Gould Belt (e.g. Walter 2001; Popov et al. 2003; Motch et al. 2003, 2005, 2009; Posselt et al. 2008), the sources are located within a few hundred parsecs of the Sun (Posselt et al. 2007; van Kerkwijk & Kaplan 2007). Their X-ray luminosity, dominated by thermal emission with no significant evidence of any magnetospheric activity, is believed to come directly from the neutron star surface. These properties make the M7 ideal targets for probing atmosphere models and cooling curves, and they can eventually be used to constrain the mass-to-radius ratio of the neutron star (e.g. Hambaryan et al. 2011). Unfortunately, the current lack of understanding of the surface composition, magnetic field, and temperature distributions have limited any definite conclusion (Kaplan et al. 2011, for an update on this issue).
Broad features in absorption are observed in the X-ray spectra of most of the sources (the exceptions being the two softest members, RX J1856.5-3754 and RX J0420.0-50221). The features are generally understood in terms of the neutron star magnetic field, although their interpretation is not unique. They can be related to cyclotron transitions of either protons (Bcyc ~ 1013 − 1014 G) or electrons (Bcyc ~ 1010 − 1011 G); while an alternative explanation would rest upon atomic transitions in the outermost layers of the neutron star (e.g. Potekhin 1998; Lai 2001; Medin et al. 2008).
Timing studies in X-rays (see Kaplan & van Kerkwijk 2011, and references therein) have shown that the M7 rotate slower (P ~ 3–10 s) and have higher magnetic field intensities (Bdip ~ few × 1013 G) than the bulk of the radio pulsar population. Also at variance with pulsars detected at high energies, their X-ray luminosity is in excess of the spin-down power, suggesting that additional heating of the neutron star crust was at work by means of field decay (Aguilera et al. 2008; Pons et al. 2009; Viganò et al. 2013). Therefore, these neutron stars may had experienced a different magneto-rotational evolution relative to standard pulsars, which consequently affected their cooling rates and detection as thermal X-ray sources (Kaplan & van Kerkwijk 2009a; Popov et al. 2010).
RX J1605.3+3249 (a.k.a. RBS 1556, Schwope et al. 2000; J1605 here for short), the third brightest INS (Motch et al. 1999), is the only source amidst the seven still lacking a detected periodicity. The source was observed by XMM-Newton (Jansen et al. 2001) in ten different occasions2 between January 2002 and February 2006, which amounted to nearly 260 ks of observing time. Results of the first five observations were reported and discussed in detail by van Kerkwijk et al. (2004). The other five XMM-Newton observations of the source, conducted in 2006, were severely affected by background flares, unfortunately reducing exposure times by more than ~80% in the EPIC cameras. Likewise, the Chandra X-ray Observatory (Weisskopf et al. 2002) targeted J1605 in two occasions. The imaging ACIS observation, conducted in 2002, was also discussed by van Kerkwijk et al. (2004). The other Chandra observation of the source, performed in 2007, aimed at high-resolution spectroscopy with the LETG instrument.
Due to visibility constraints, the source could only recently be targeted again by the XMM-Newton satellite. We report here the results of a new observation, which was finally able to unveil a candidate spin for the neutron star. The paper is structured as follows: in Sect. 2 we describe the new XMM-Newton observation and the data reduction. Data analysis and results are presented in Sect. 3. We discuss the implications of our findings in the context of the M7 as a group, and in the light of the properties of the observed population of Galactic neutron stars in Sect. 4. Our main results and conclusions are summarised in Sect. 5.
2. Observations and data reduction
The observation was carried out on 2012 March 6, for a total exposure time of 60.418 ks. Table 1 contains information on the scientific exposures and instrumental setup of the RGS (den Herder et al. 2001), EPIC-pn (Strüder et al. 2001) and EPIC-MOS (Turner et al. 2001) detectors.
2.1. EPIC data reduction
The EPIC cameras were operated in full-frame mode with thin filters. Standard data reduction was performed with SAS 13 (xmmsas_20130501_1901-13.0.0) using the latest calibration files.
Instrumental configuration and duration of the EPIC and RGS scientific exposures of the XMM-Newton AO11 observation of RX J1605.3+3249.
We processed the MOS and pn raw event files using the EPIC meta tasks emchain and epchain, respectively, applying default corrections. We ensured that the pn event file was clean of unrecognised time jumps (i.e. those uncorrected by standard SAS processing).
Parameters of RX J1605.3+3249, as extracted from the AO11 XMM-Newton EPIC observations.
Background flares were registered during the beginning and towards the end of the EPIC observation. The effective observing times, after filtering out periods with background levels higher than those recommended by standard XMM-Newton data reduction, are 40 ks for pn and 51 ks for MOS. For the analysis, we filtered the event lists to exclude bad CCD pixels and columns, as well as to retain the pre-defined photon patterns with the highest quality energy calibration. Unless otherwise noted, single and double events were selected for pn (pattern ≤4) and single, double, triple, and quadruple for MOS (pattern ≤12). We defined the source centroid and optimal extraction region for each EPIC camera with the task eregionanalyse in the energy band 0.2–1.2 keV. Background circular regions of size 60′′ to 100′′ were defined off-source, on the same CCD as the target.
The detected source count rates, hardness ratios, and other parameters based on a maximum likelihood fitting (as determined with the SAS task emldetect on the EPIC images in each camera and energy band) are listed in Table 2. We used the task eposcorr to refine the astrometry, by cross-correlating the list of EPIC X-ray sources in the field-of-view with those of optical (GSC 2.3.2, Lasker et al. 2008) objects lying within 15′ from J1605. We found offsets of −1.6′′ ± 0.3′′ in right ascension and −0.5′′ ± 0.3′′ in declination, based on a number of forty-six X-ray/optical matches.
The corrected EPIC source position (Table 2), updated accordingly, was found consistent within errors with previous determinations (Kaplan et al. 2003), taking into account the known proper motion of the source (derived from the more accurate observations of the optical counterpart; Motch et al. 2005; Zane et al. 2006). The statistics for the EPIC lightcurves (corrected for bad pixels, deadtime, exposure, as well as background counts, and binned into 600 s intervals) show the 3σ upper limits for the r.m.s. fractional variation of 0.018, 0.04 and 0.05 for pn, MOS1, and MOS2, respectively. On the basis of the same lightcurves, the reduced  assuming a constant flux is 1.17 (pn, 78 d.o.f.), 1.14, and 0.90 (MOS1 and MOS2; 90 and 89 d.o.f.), corresponding to null-hypothesis probabilities of 14%, 17%, and 74%.
2.2. RGS data reduction
We processed the RGS data using the SAS routine rgsproc. Following standard procedure, we identified times of low background activity from the count rate on CCD 9, the closest to the optical axis, and applied a count rate threshold of 0.1 s-1 to filter the good-time intervals. The final exposure times and net count rates are ~51 ks and 0.1053(16) s-1, and ~52 ks and 0.08852(15) s-1, in RGS1 and RGS2, respectively, in the 0.35–1.0 keV energy band. Due to electronic problems3, one CCD chip of each of the RGS detectors failed early in the mission; these affect the spectral coverage between 11 Å and 14 Å and between 20 Å and 24 Å, respectively, in RGS1 and RGS2.
3. Analysis and results
3.1. Unveiling the neutron star spin period
Searches for a periodic signal in previous observations of the source revealed no statistically significant candidate for the neutron star spin; the derived upper limit on the pulsed fraction was pf ≲ 5% at the 95% confidence level, in the frequency range of 0.01 Hz to 800 Hz (van Kerkwijk et al. 2004). It is worth noting that the EPIC pn observations on which these previous studies were based were performed in timing mode, which requires a larger photon extraction area, consequently resulting in a higher background and lower signal-to-noise ratio in the period search.
For the timing analysis, we considered events with pattern 12 or lower, and tested different energy bands and radii of the source extraction region. To achieve the maximum sensitivity of our data, we used the event lists of the three EPIC cameras unfiltered for background flares (Sect. 2.1), after checking that the soft energy band is not severely affected by them4. To avoid aliasing artefacts in the timing power spectra, only the first (and longest) exposures in each of the MOS cameras were considered, since the merged event files have a ~5 ks gap in between exposures, after the event of a background flare (Table 1). The times-of-arrival of the pn/MOS photons were converted from the local satellite to the solar system barycentric frame using the SAS task barycen and the source coordinates in each camera (Table 2). A  (Rayleigh) test (Buccheri et al. 1983) was applied to search for pulsations. The adopted step in frequency was 2 μHz (or an oversampling factor of 10), warranting that a peak corresponding to a periodic signal is not missed.
In full-frame mode, pn and MOS provide a time resolution of 73.4 ms and 2.6 s, respectively, with negligible deadtime. Therefore, searches conducted over photons from the three EPIC cameras are restricted to periodicities longer than P > 5.2 s. We found no significant pulsations, with pulsed fraction higher than 1.6% (3σ), in this period range (total of ~240 600 photons in the energy band 0.2–1.5 keV; the number of independent trials is ~104). To look for higher frequency pulsations, with periods as short as P ~ 0.15 s, we restricted the analysis to the pn camera and performed more extensive searches.
Very interestingly, we found that a periodic signal at frequency ν ≡ ν⋆ = 0.2951712(14) Hz is revealed when the search is restricted to photons with energy higher than ~0.5 keV. The same frequency, however with a less significant  power, is also the highest when the test is performed over the background-filtered event lists or with different photon patterns and radii of the source extraction region (we tested photon patterns 0, 4 and 12 and radii between 5′′ and 40′′). We ensured that no high power is detected when the search is performed over photons extracted from several background regions (in several energy bands and with roughly the same total number of counts as collected for J1605) hence excluding the possibility that the signal is associated with unknown instrumental effects.
We refined the search around the found periodicity in order to find the best choice of parameters that maximises the power of the test. We found that the peak at period P ≡ P⋆ = 3.387864(16) s has a maximum power of  in the energy band of 0.5 − 1.69 keV and for an extraction radius of 9′′, which amounts to Nph ~ 3.69 × 10⁴ photons in the search (Fig. 1, bottom); the
  power corresponds to a detection at 4.3σ for this choice of parameters (3.25 × 10⁵ independent trials in the ν = 0.01 − 6.81 Hz frequency range). By contrast, no frequency with pulsed fraction higher than pf = 3% (3σ) shows a significant power in the test in either the energy band where the bulk of the source photons are emitted, 0.2 − 1.7 keV, or in the very soft energy range of 0.2 keV to 0.5 keV (total of ~119 000 and ~82 500 pn events, respectively; see top and centre plots of Fig. 1); this suggests that most of the source photons show very low amplitude modulation and easily smear out the significance of the signal detected at harder energies. It is nonetheless interesting to note that the found periodicity is within the narrow range of measured spin periods of the other M7 (e.g. Haberl 2007), which we discuss further in Sect. 4.1.
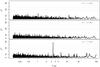 |
Fig. 1 Results of the |
The pn lightcurve in the energy band 0.5−1.69 keV, folded at the found periodicity and corrected for background counts and other effects, can be seen in Fig. 2. The pulsed fraction computed from the best sinusoidal fit is pf = 5.1(7)%, in agreement with the results from the analysis with optimised search parameters,  . The inclusion of higher harmonics n ≥ 2 in the test was found to be statistically insignificant, as evident by the sinusoidal pulse profile of the modulation.
3.2. Pulsar spin down
We checked if the candidate period could had been detected in previous XMM-Newton observations of J1605. The only past pn observation of the source suitable for timing analysis5 is the one performed in 2003 (obsid 0157360401), with an exposure time of ~33 ks. We processed and analysed this observation in the same way as described in Sects. 2.1 and 3.1. By adopting the best energy band and parameters as found for the AO11 data, we extracted a number of ~19 800 source photons for the timing analysis, which were barycentre corrected accordingly.
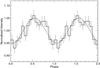 |
Fig. 2 Background-subtracted light curve for pn, folded at the spin period P ~ 3.39 s. Two cycles are shown for clarity. The energy band is 0.5 − 1.69 keV and the size of the extraction region is 9′′. A best-fit sinusoidal curve to the folded light curve is superposed in dashed line. |
Accounting for the time span of Tspan ~ 2.88 × 10⁸ s between the two datasets and a 3σ uncertainty on ν⋆, we searched for significant peaks allowing for a maximum braking corresponding to that of a pulsar with Bdip = 1014 G (assuming the usual pulsar spin-down formula of magnetic dipole braking in vacuum, see e.g. Sect. 4). We found no significant pulsation in the frequency range of the search. The 4σ upper limit on the pulsed fraction, pf = 4.6%, shows that the 2003 observation is just as the limiting sensitivity to detect the shallow modulation found in the longer dataset.
Summary of XMM-Newton observations of RX J1605.3+3249 used in the spectral analysis.
Regardless of the lower sensitivity of the 2003 observation, the data can still be used in combination with the AO11 observation in a coherent two-dimensional  search, i.e. allowing the Z2 test to account for the neutron star spin down (see e.g. Pavlov et al. 1999, for details). In this case, the ephemeris parameters
  that determine the phase φj of each photon time-of-arrival,
 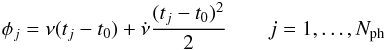 (1)
(1)
are estimated as the values that give the highest power of the statistics (similarly as before, t0 is the event time-of-arrival counted from an epoch of zero phase and Nph = 56 645 is the total number of photons in the search when joining the two datasets).
Again allowing for a maximum braking that corresponds to a field of Bdip = 1014 G,  Hz s-1, we searched the relevant parameter space in steps of 10-9 Hz and 3.6 × 10⁻¹⁸ Hz s-1; the number of independent trials is
  . We found that the highest peak, Z2 ~ 46.3 occurs at
  Hz, − 1.386075 × 10⁻¹³ Hz s-1), and corresponds to a fractional amplitude of pf = 4%, overall consistent with our results in the individual datasets. The significance of the detection is 2σ; no other pair was found above the 1σ confidence level.
3.3. Spectral analysis
The spectral energy distribution of J1605 is known to deviate from a pure blackbody, due to the presence of a broad line in absorption at energy ~0.45 keV (van Kerkwijk et al. 2004). Similar features are also reported in the spectra of other thermally emitting INSs (Sanwal et al. 2002; Haberl et al. 2003; Zane et al. 2004, 2011; Mori et al. 2005; Haberl 2007; Schwope et al. 2007; McLaughlin et al. 2007; Pires et al. 2012). Evidence for the presence of a narrow absorption spectral feature at energy ~0.57 keV, possibly related to either interstellar or circumstellar highly-ionised oxygen, was found in the co-added RGS spectra of the source (van Kerkwijk et al. 2004; Hohle et al. 2012a).
3.3.1. EPIC data
The analysis of the EPIC data is based on source and background spectra extracted from regions as described in Sect. 2.1, together with the respective response matrices and ancillary files created for each of the EPIC cameras. We also included in the spectral analysis the past pn and MOS exposures of the source conducted with the thin filter and not severely affected by background flares (Table 3; the archival observations are listed “A” to “E” as reference for the text). The available data amount to a total of 14 spectra and 4.1 × 10⁵ counts in energy band 0.2–1.5 keV (of which ~2.5% can be ascribed to background). We reprocessed and reduced all observations in consistency with the AO11 dataset.
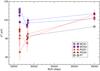 |
Fig. 3 Best-fit blackbody temperature of RX J1605.3+3249 in each observation and XMM-Newton detector of Table 3 (see caption). Errors are 1σ. |
Due to the brightness of the target and the use of the thin filter, approximately ~3.6% and 1.5% of the pn photons in the AO11 and “D” observations, respectively, were affected by pile-up. To minimise spectral distortion, a correction in the redistribution matrix files of the pn camera (calculated from the frequency and spectrum of the incoming photons) was applied6. For all spectra, energy channels within 0.3 keV and 1.35 keV were rebinned according to a minimum number of 30 counts per spectral bin and we took care not to oversample the instrument energy resolution at a given bin by more than a factor of three, which is especially important at soft energies.
Results of spectral fitting.
To fit the spectra, we used XSPEC 12.7.1 (Arnaud 1996). The photoelectric absorption model and elemental abundances of Wilms et al. (2000, tbabs in XSPEC were adopted to account for the interstellar absorption. We note that the choice of abundance table and cross-section model in XSPEC does not impact the results of spectral fitting significantly, due to the low absorption towards J1605. We fitted the data of each camera and observation individually; additionally, to more tightly constrain the spectral parameters, we performed simultaneous fits, where we allowed for a renormalisation factor to account for cross-calibration uncertainties between the detectors and possible time variability of the spectral parameters.
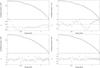 |
Fig. 4 Results of spectral fitting of source J1605 (EPIC). We show the combined EPIC spectra and folded best-fit models, with residuals. Top left: simple blackbody model. Top right: double blackbody model. Bottom left: double blackbody model with one Gaussian absorption line. Bottom right: double blackbody model with two Gaussian absorption lines. |
The observed flux of J1605 is stable between the two pn observations, and consistent with a constant value (Table 3). Similarly, there is no evidence for flux variability in the RGS1/2 data (Sect. 3.3.2). On the other hand, significant flux and temperature variations are seen between the MOS1/2 exposures, as well as between the two detectors for a given epoch (see Fig. 3, where we plot the best-fit kT∞ of a simple blackbody model for each observation and XMM-Newton detector as a function of time). The MOS CCDs are known to suffer from redistribution changes and contamination with time, making the instrument unsuitable for long-term studies7. Regarding the two available pn observations, we measured a 3% relative increase in the blackbody temperature, which is formally significant within the typical errors of this instrument at the flux level of J1605. A similarly higher temperature is also measured in the most recent RGS1/2 observation with respect to the archival data. Contrarily to pn, such increase is not significant and is also not seen in the MOS data. The agreement of the derived spectral quantities is generally good between pn and RGS, and overall within the cross-calibration uncertainties between all instruments on-board XMM-Newton8. We therefore regard these discrepancies within the expected calibration uncertainties, rather than evidence of significant variability in the source physical properties within the time span of the analysis.
The results of our spectral fits are summarised in Table 4. We list for each spectral model, numbered (1–6) as reference for the text, the reduced chi-squared and degrees of freedom (d.o.f.), the equivalent hydrogen column density NH, model-dependent parameters (blackbody temperature kT∞, energy ϵ and width σ of Gaussian absorption lines), line equivalent width (EW), and the unabsorbed source flux FX in the 0.2 − 12 keV energy band (when considering simultaneous fits, we list the average between the detectors). The fit parameters were allowed to vary freely (unless otherwise noted), and within reasonable ranges – in particular, restricting line energies between 0.3 keV and 1.35 keV, blackbody temperatures between 10 eV and 200 eV, and the Gaussian σ between 5 eV and 200 eV. Uncertainties in the fit parameters represent 1σ confidence levels. For the AO11 observation, results of spectral fitting in Table 4 are given for the pn camera alone and for the simultaneous fitting of the three EPIC instruments. Additionally, using the task epicspeccombine, we combined all 14 spectra and corresponding background and response files into one dataset; the results of spectral fitting of the combined spectrum9 are also listed in Table 4; folded models and residuals are shown in Fig. 4. In the following, we discuss the spectral fitting in detail.
We first tried fitting a simple blackbody (1). The fit, as expected, is very unsatisfactory. The best-fit column density is very low and unconstrained. Absorption features at energies around 0.4 keV and 0.8 keV and an excess of counts at soft energies (which are seen in the residuals of all EPIC cameras) mostly contribute to the high value of χ2 (see Fig. 4, top left).
The inclusion of a single Gaussian line in absorption at energy ~0.4 keV (2), while significantly improving the quality of the fit (lowering the reduced chi-square by a factor of 2 to 5, depending on the camera), is still a poor description of the spectrum of the source. The column density remains unconstrained and a somewhat lower temperature is found. Adding one more line in absorption to this simple blackbody model (3) lowers further the reduced chi-square, although not to a statistically acceptable value ( for 86 degrees of freedom in the simultaneous EPIC fit). In general, the energy of the second line was found consistent with the ratio ϵ2 = 2ϵ1, which we discuss in Sect. 4.3.
As hinted by the excess of counts at soft energies, we found that the inclusion of a second cooler blackbody component, with best-fit temperature of  eV, provides a much better description of the source continuum (4). However, the residuals at the line energies remain (see Fig. 4, top right), and the column density tends to exceed the galactic value of
  cm-2 (Dickey & Lockman 1990) in this direction. Moreover, the emission radius as seen by an observer at infinity implied by the cool blackbody component is large,
  km, assuming a distance of d ~ 350 pc (Posselt et al. 2007) to the source. Therefore, we restricted NH within 0 and
  and added one (5) or two (6) Gaussian lines to the double blackbody continuum to look for acceptable fits.
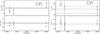 |
Fig. 5 Best-fit spectral parameters of RX J1605.3+3249. Data points are results from fitting the MOS and pn spectra from the XMM-Newton observations in Table 3. The spectral model corresponds to a double blackbody with two Gaussian absorption features (model (6) in Table 4). We show the best-fit temperature of the cool and hot blackbody components (left), as well as the best-fit line energies (right). Errors represent 1σ confidence level. Solid horizontal lines show results for the fit of the combined EPIC spectrum (1σ errors are displayed as dashed lines). |
With one line in absorption at a best-fit energy of ϵ1 ~ 0.39 keV, a double blackbody model provides a fit with  for 87 d.o.f., and a column density below the galactic value, NH = 2.07(23) × 1020 cm-2 in the simultaneous EPIC fit. With respect to model (4), the temperature of the cool component is higher,
  eV, implying a radiation radius of
  km. Significant residuals, especially seen in the pn (and in the combined) spectra, still remain at around the energy of the second feature, ϵ2 ~ 0.85 keV (bottom-left plot of Fig. 4), which motivates the inclusion of one further spectral component.
Finally, fitting the data with a double blackbody model and two Gaussian absorption lines results in a reduced chi-square of 1.5 for 85 d.o.f. (in the simultaneous EPIC fit). The value of the best-fit column density is higher with respect to model (5), although still consistent within one standard deviation of . The temperature of the cool blackbody component,  eV in the simultaneous EPIC fit, corresponds to a radiation radius of
  km. The inclusion of a power-law tail extending towards higher energies, as usually seen in the emission of middle-aged pulsars dominated by soft thermal components (age ~ few 105 yr, e.g. the “Three Musketeers”; De Luca et al. 2005), has no effect on the best-fit parameters of model (6) and does not significantly improve the χ2. We found that non-thermal power-law components, with typical photon indices of Γ = 1.7 − 2.1 contribute at most ~0.3% (3σ confidence level, 0.2–12 keV range) of the unasorbed flux of the source.
In general, consistent results were found between the detectors in the AO11 observation, as well as for the simultaneous fit of all spectra and observations. The fit results of spectral model (6) can be seen in Table 4 for each observation in Table 3. Where appropriate, a simultaneous fit of the two (MOS) or three (MOS+pn) EPIC detectors is performed for each observation. In Fig. 5, the temperature of the two blackbody components, as well as the energies of the two absorption lines, are plotted as a function of time (MJD). For comparison, horizontal lines show the corresponding values of fitting the combined EPIC spectrum, with 1σ confidence levels. Although significant variations are seen from observation to observation, they more likely reflect the still poor model description of the spectral energy distribution of the source, as well as to cross-calibration uncertainties between the detectors.
3.3.2. RGS data
Similarly to EPIC, we also included in the RGS spectral analysis all archival data not severely affected by background flares (Table 3). All observations were reduced in consistency with the AO11 data (Sect. 2.2). To extract the source and background spectra, we used the standard instrument spatial masks and energy filters as well as GTI-filtered event lists. The source position, as inferred from the EPIC images (Table 2), was used to define the spatial extraction regions and the wavelength zero-point with the task rgsregions. Source and background spectra, and the corresponding redistribution matrix files in each RGS camera, were created with the tasks rgsspectrum and rgsrmfgen. Only the first order spectra are taken into account. Due to the failure of chip 7 in RGS1 and of chip 4 in RGS2 (Sect. 2.2), we ignored in the spectral fitting the corresponding defective channels of each instrument. As for the EPIC data, we allowed for a renormalisation factor between the two detectors; the energy band of the analysis is 0.35–1 keV.
The average flux in the RGS detectors, weighted by the errors ( erg s-1 cm-2 in energy band 0.35–2.5 keV), is consistent with a constant value (χ2 = 5.4 for 5 d.o.f.). The blackbody temperature between observations is also constant within errors (weighted mean kT = 97 ± 3 eV; χ2 = 3.1 for 5 d.o.f.). Since the source showed no evidence of significant variability in its spectral parameters, we co-added all spectra into two single files (one for each RGS detector), taking into account the different responses and background spectra, and binned the results to 0.18 Å to improve the signal-to-noise ratio. The total counts of the co-added RGS1/2 spectra in energy band 0.35–1 keV amount respectively to 5.8 × 10⁴ and 5.1 × 10⁴.
As for EPIC, the fit of a simple blackbody model, with best-fit  eV, to the co-added RGS1/2 spectra clearly shows the excess of counts at soft energies. The inclusion of a second blackbody component, with best-fit
  eV, improves the quality of the fit by
  . Due to the shorter spectral coverage of the RGS instrument at soft energies and the unconstrained NH, the temperature of the cool blackbody component is significantly softer than that derived in the EPIC fits. Following the results from the EPIC analysis, we included two broad Gaussian features in absorption, with energies
  eV (
eV ( eV and equivalent width 31 eV) and ϵ2 = 828(5) eV (σ2 = 15 ± 4 eV and equivalent width 13 eV). The inclusion of a narrow absorption feature as reported in van Kerkwijk et al. (2004); Hohle et al. (2012a) gives a central energy of ϵ = 576 ± 8 eV and Gaussian width
  eV (equivalent width 5 eV), overall consistent with previous results. The column density,
  cm-2, is consistent with the galactic value. The final reduced chi-square is
  for 213 d.o.f.
4. Discussion
We summarise and discuss our findings in the light of the observed properties of the other members of the group of the “Magnificent Seven” isolated neutron stars. To help in the discussion we list in Table 5, when appropriate for each of the seven objects, the temperature kT∞ of the best-fit single absorbed blackbody model; the spin period P and pulsed fraction pf; the spin down Ṗ, spin-down luminosity Ė = 4.5 × 1046(ṖP-3) erg s-1, dipolar magnetic field Bdip = 3.2 × 10¹⁹(PṖ)1/2 G, and characteristic timescale τch = P(2Ṗ)-1; the kinematic age from proper motion associations tkin; and the magnetic field derived from spectral proton cyclotron absorption (e.g. Zane et al. 2001). For a recent compilation of the spectral and magneto-rotational properties of a sample of INSs with bright thermal X-ray emission, we refer to Viganò et al. (2013), as well as to these authors’ on-line catalogue10.
Overall properties of the M7.
4.1. Neutron star rotation
We have presented the results of a new XMM-Newton observation of the M7 neutron star RX J1605.3+3249. The higher count statistics and longer exposure (58 ks) of the EPIC-pn camera with respect to past XMM-Newton observations of the source have permitted the measurement of the period of the very likely neutron star rotation, at a value of P ≡ P⋆ = 3.387864(16) s that is the shortest amidst the M7 INSs, although comparable to that of RX J0420.0-5022 (Table 5). The pulsed fraction of the modulation is energy dependent and at best measured at 5% for energies above ~ 0.5 keV, which correspond to a ~4σ detection in a blind search. We exclude the possibilty that the signal at P⋆ being associated with unknown instrumental effects, having found no significant signal in the searches performed over photons extracted from several background regions, with roughly the same number of counts as collected for J1605 (Sect. 3.1). The analysis of the three EPIC cameras together more tightly constrains any periodicities with pf ≳ 1.6% (3σ) and P > 5.2 s, thus considerably improving previous limits in this frequency range.
Our analysis shows that only the harder portion of the source spectrum – namely, the photons with energy above ~0.5 keV, or roughly ~30% of all source events – shows a significant modulation within the sensitivity of our data. In the soft energy band of 0.2 − 0.5 keV, the pulsed fraction for pulsations in range P = 0.1468 − 100 s is constrained to be below pf ≲ 3% (3σ). Interestingly, Tiengo & Mereghetti (2007) also reported evidence for a pulsed fraction increasing as a function of energy in the EPIC-pn data of the brightest INS amongst the M7, RX J1856.5-3754. Other members of the group similarly show changes in the pulse profile as a function of energy band, as well as phase-dependent spectral variations (of e.g. hardness ratio, depth of absorption lines; Haberl et al. 2003, 2004b).
4.2. Candidate spin down and INS populations
The analysis of the 2012 and 2003 EPIC-pn observations of J1605 in a joined two-dimensional  search (Sect. 3.2) provides a tentative candidate for the pulsar spin down of
  Hz s-1. Such spin down implies a dipolar magnetic field of Bdip ~ 7.4 × 10¹³ G, under the usual assumption of magnetic braking in vacuum. A close estimate, Bcyc ~ 8.3 × 10¹³ G, is derived from the line energy detected in the spectrum of the source, assuming that the feature at energy ϵ ~ 0.4 keV is the fundamental proton cyclotron absorption (Zane et al. 2001; we further assume a canonical value of the gravitational redshift on the stellar surface of zg = 0.3, for a neutron star mass and radius of Mns = 1.4 M⊙ and Rns = 10 km, respectively). Despite the fact that our best spin-down solution being detected at a low confidence level (2σ), our analysis excludes any other spin-down value at a significance higher than 1σ, for Bdip = 0 − 1014 G. If confirmed, J1605 would be the neutron star with the highest dipolar field amongst the M7.
In other members of the group, magnetic field estimates derived from both timing and spectral features similarly agree within a factor of a few, with the exception of the sources RX J2143.0+0654 and RX J0806.4-4123 (see Kaplan & van Kerkwijk 2009a,b, for a discussion; we note that the timing solutions of these INSs are not as well constrained as those of the other sources). In general, estimates derived from spectral lines are systematically higher than those from dipole braking. The absence of spectral lines in the spectrum of RX J1856.5-3754 and RX J0420.0-5022 also seems consistent with the weak magnetic field derived from spin down (van Kerkwijk & Kaplan 2008; Kaplan & van Kerkwijk 2011).
We plot in Fig. 6 the tentative position of J1605 in the P − Ṗ diagram of Galactic isolated neutron stars. The bulk of the population, characterised by the standard rotation-powered radio pulsars, is shown in the background whereas we highlight the position of peculiar groups of INSs, namely those of magnetars (see e.g. Mereghetti 2008, for a review), the M7, rotating radio transients (RRATs, McLaughlin et al. 2006; Keane & McLaughlin 2011), and CCOs (a.k.a. anti-magnetars, Halpern & Gotthelf 2010; Gotthelf & Halpern 2010).
The regions in the P − Ṗ diagram occupied both by the M7 and RRATs show considerable overlaps with those of the two opposite extremes of neutron star behaviour, observed namely in magnetars and ordinary radio pulsars. The discovery of RRATs, in particular, is intriguing since these sources have so far manifested themselves in a variety of ways. The most active source among the known sample is the highly magnetised RRAT J1819-1458, the only one11 so far detected in X-rays (McLaughlin et al. 2007; Camero-Arranz et al. 2013). Very interestingly, the X-ray source was found to exhibit a spectrum remarkably similar to those of the M7, although the RRAT is expected to be more distant and younger. Unusual timing behaviour following glitches detected in the radio indicates that this source could also have evolved from a magnetar (Lyne et al. 2009). It seems likely that several physical mechanisms are required to explain all the transient RRAT sources and the totality of distinct burst behaviours. This would imply that there is no unifying scenario that can account for all of their properties and that the intermitent radio emission might be due to factors both intrinsic and extrinsic to the neutron star as well as to selection biases. With the increasing number of newly discovered sources (e.g. Deneva et al. 2009; Keane et al. 2011), these issues can be addressed and new scenarios can be proposed to explain their unusual radio emission.
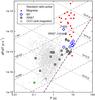 |
Fig. 6 P − Ṗ diagram highlighting the position of peculiar groups of isolated neutron stars (see legend). The tentative location of the M7 neutron star RX J1605.3+3249 is labelled, as that of the only rotating radio transient (RRAT) so far detected in X-rays, RRAT J1819-1458. |
On the other hand, the seven ROSAT-discovered INSs seem to form a rather homogenous class of cooling neutron stars. In particular, the sources show very similar timing and spectral behaviour, with perhaps only one exception: the long-term spectral variations of RX J0720.4-3125 (Hohle et al. 2012b, and references therein). Nonetheless, it is striking that a group of very similar sources, displaying at the same time unique properties that are so different from ordinary radio pulsars, are detected in the very local Solar vicinity. Indeed, the thermal X-ray luminosity of the M7 is in general higher than the power available from spin down, roughly by a factor of ten, which is in contrast to what is measured for radio pulsars detected at high energies, usually with LX ≲ 10-1Ė. Even higher factors of LX/Ė ~ 102−103 are measured for magnetars, suggesting that these neutron stars are too bright to be consistent with standard neutron star cooling (e.g. Yakovlev & Pethick 2004).
The role played by the decay of the magnetic field in heating the neutron star crust, including state-of-art microphysics and the effect of Hall induction and Ohmic dissipation, has been investigated by Viganò et al. (2012, 2013, and references therein), in a worthy attempt to unify the several groups of INSs and explain the observed neutron star phenomenology. They found that, whereas for the bulk of the neutron star population the effect of the magnetic field on the luminosity is negligible, the magneto-thermal evolutionary models with original polar fields in range  G can account for the range of observed temperature, luminosity, age, as well as the timing properties of the M7 as the original field dissipates; magnetars with more extreme properties would require even higher original fields (
 G) to explain their luminosities and timing properties.
Our best (P,Ṗ) solution implies a spin-down luminosity of Ė ~ 1.8 × 1033 erg s-1, which is significantly higher than the range measured for the other M7 stars, Ė ~ 1030−1031 erg s-1. The spin period of P ~ 3.38 s is short for M7 standards, but comparable to that of the weakest-magnetised source RX J0420.0-5022. A fast-spinning neutron star would suggest the idea of a lower initial magnetic field and less dramatic spin down, in contrast to our result. However, the correlation between current magnetic field and period is not clear: both RX J0806.4-4123 and RX J2143.0+0654 have long periods but relatively weak dipolar fields, to mention one example.
The characteristic age derived from our best solution, τch ~ 3.4 × 10⁴ yr, is also deviant from the typical few Myr measured for the other sources (Table 5). Moreover, it implies a short evolutionary time scale that is inconsistent with the kinematic age derived from proper motion studies (tkin = 4.5 × 10⁵ yr; Tetzlaff et al. 2012). While spin-down ages are known to be reasonable estimators of a neutron star true age only under certain circumstances12, they usually overestimate the true pulsar age – again, in contrast to our result. The (thus far) remarkably homogeneous timing properties of the M7 would argue against such a high value of spin down and discrepant associate quantities (Ė, τch). Additional data are required to definitely pin down the timing solution of this neutron star.
4.3. Spectral energy distribution and lines in absorption
The energy distribution of J1605 in X-rays shows evidence for the presence of a cooler blackbody component with  –60 eV, as well as of two absorption features, in addition to the blackbody with
  –110 eV. Non-thermal components extending towards higher X-ray energies are excluded at a level above ~0.3% (3σ) of the source unabsorbed flux in the 0.2 − 12 keV energy band. The upper limit on the non-thermal luminosity is
  erg s-1, much lower than the thermal X-ray component of a few 1032 erg s-1, or the rotational energy derived from our best (P,Ṗ) solution (Table 5).
The detection of spectral features in absorption in several (non-accreting) thermally emitting neutron stars have been made possible thanks to the high sensitivity and spectral resolution of the XMM-Newton and Chandra observatories. Intriguingly, evidence for lines occurring at harmonically spaced energies has been suggested, where the best case study is the CCO 1E 1207.4-5209 (Sanwal et al. 2002; Bignami et al. 2003; Mori et al. 2005; see e.g. van Kerkwijk & Kaplan 2007, for the M7). In contrast to accreting X-ray pulsars, where harmonics of the electron-cyclotron fundamental are essentially a relativistic phenomenon, Suleimanov et al. (2010) have shown that harmonically spaced features in CCOs can be associated to quantum effects in the energy dependence of the free-free opacity. Likewise in the M7, where stronger magnetic fields of a few 1013 G have been inferred from timing measurements, absorption lines can be associated with cyclotron processes of protons or ions. The occurrence (or suppression) of harmonics is, however, not clear, as a systematic investigation of such processes occurring in the atmosphere of these neutron stars has not yet (to our knowledge) been conducted so far. Furthermore, the evidence for multiple lines in the observed spectrum of J1605 has no unique interpretation, as they may consist of a blend of atomic (H, He) transitions in addition to a possible fundamental proton cyclotron line at ~0.4 keV.
High-resolution spectroscopy with the RGS instrument confirms the presence of a narrow absorption feature at energy 0.57 keV, possibly related with absorption of highly-ionised oxygen. Hohle et al. (2012a) investigated the RGS spectra of several bright INSs to find that narrow features are positively present in the spectra of those neutron stars that tend to be more distant and/or likely surrounded by a denser medium. The exact origin of the feature, if interstellar or in the atmosphere of the neutron star, is still under debate (see e.g. Hambaryan et al. 2009; Hohle et al. 2012a, for a discussion).
The distance estimated towards J1605 of d = 350 ± 50 pc – derived from the amount of interstellar absorption in the X-ray spectrum of the source (Posselt et al. 2007) – is not as reliably determined as in the cases where parallactic measurements are possible (Walter et al. 2010; Kaplan et al. 2007). It gives for our best model (Table 4) emission radii of km and  km. Evidence for a two-temperature model is also often found in the spectra of CCOs, some transient AXPs and that of the intriguing pulsar Calvera (Zane et al. 2011). In general, the emission radii (as seen by an a distant observer) are typically smaller than a few km, and are accompanied by unusual pulse profiles and strong pulsed fractions (see Gotthelf et al. 2010, and the case of the CCO RX J0822-4300 in the supernova remnant Puppis A), suggesting the framework of a model where hot spots are present at the neutron star surface. The large difference in intensity between the crustal and dipolar components of the magnetic field of the neutron star may indeed give origin to temperature anisotropies on the neutron star surface (Turolla et al. 2011; Shabaltas & Lai 2012).
The fact that most of the source photons show very low amplitude modulation, as well as the evidence for a double-temperature spectral model, might be used to constrain the temperature surface distribution and the geometry/orientation of the neutron star axes. Detailed phase-dependent spectral evolution studies, invoking an anisotropic temperature distribution based on polar caps with different temperatures and sizes, and not located at exact antipodal positions, have been carried out for several other neutron stars (e.g. Schwope et al. 2005; Zane & Turolla 2006; Gotthelf et al. 2010; Hambaryan et al. 2011). A similar approach for J1605, although not the scope of the present paper, is strongly encouraged.
5. Summary and conclusions
Our most recent XMM-Newton observation of the “Magnificent Seven” neutron star RX J1605.3+3249 has, most notably, revealed a candidate for its spin period at a value of P ~ 3.38 s (4σ) that is comparable to the range observed in the other members of the group. Our analysis shows that the amplitude of the modulation is strongly energy dependent, and is only significantly detected at harder energies (in particular, roughly above the energy of the first spectral feature at energy ~0.5 keV). The coherent combination of the new data with a past XMM-Newton EPIC-pn observation of the source constrains the pulsar spin-down rate at the 2σ confidence level, implying a dipolar magnetic field of Bdip ~ 7.4 × 10¹³ G. If confirmed, this would rank the highest amongst the M7. Spectral features in absorption, as well as a narrow absorption feature at energy 0.57 keV that is commonly observed in the spectra of other thermally emitting INSs, have also been positively identified. Moreover, we found compelling evidence for a two-temperature spectral distribution, which might explain the non-pulsating part of the source spectrum. Phase-resolved spectroscopy, as well as a dedicated observing campaign aimed at determining a timing solution, can give invaluable constraints on the neutron star geometry, allowing one to confirm a high value of spin down hinted by our analysis of the available XMM-Newton data on the source.
We note that a spectral line in absorption at energy ~0.3 keV in the spectrum of the latter is disputed, probably as a result of uncertainties in the calibration of EPIC at the lowest energies (see Haberl et al. 2004a; Kaplan & van Kerkwijk 2011 for details).
In four other observations, J1605 was targeted for calibration purposes.
We note that results of the timing analysis are unchanged when using the filtered event list sets (see main text).
Other archival EPIC-pn observations of the source were either conducted in timing mode, operated with the thick filter, or severely affected by background flares.
As of SAS 13, the task rmfgen includes an option to correct for the flux loss and energy distortion caused by the pile-up of photons within a single frame (only available for pn imaging).
We note that these best-fit parameters are consistent with those resulting from the simultaneous fitting of all 14 datasets.
Of the nearly 70 objects known to date, ~20 have precise position determinations and several have been investigated in X-rays, (Rea & McLaughlin 2008; McLaughlin 2009; Kaplan et al. 2009; Rea et al. 2010).
Namely, if the initial rotation period was much shorter than the present value, and the magnetic field remained constant during the entire neutron star life; moreover, it is assumed that no additional braking due to e.g. the interaction with a fall-back disk has occurred, i.e. the pulsar is a perfect dipole rotator in vacuum.
Acknowledgments
The work of A.M.P. is supported by the Deutsche Forschungsgemeinschaft (grant PI 983/1-1). The authors acknowledge the use of the ATNF Pulsar Catalogue (http://www.atnf.csiro.au/research/pulsar/psrcat). We thank the anonymous referee for suggestions that helped improving the manuscript.
References
- Aguilera, D. N., Pons, J. A., & Miralles, J. A. 2008, ApJ, 673, L167 [NASA ADS] [CrossRef] [Google Scholar]
- Arnaud, K. A. 1996, in Astronomical Data Analysis Software and Systems V, eds. G. H. Jacoby, & J. Barnes, ASP Conf. Ser., 101, 17 [Google Scholar]
- Bignami, G. F., Caraveo, P. A., De Luca, A., & Mereghetti, S. 2003, Nature, 423, 725 [NASA ADS] [CrossRef] [PubMed] [Google Scholar]
- Buccheri, R., Bennett, K., Bignami, G. F., et al. 1983, A&A, 128, 245 [NASA ADS] [Google Scholar]
- Camero-Arranz, A., Rea, N., Bucciantini, N., et al. 2013, MNRAS, 429, 2493 [NASA ADS] [CrossRef] [Google Scholar]
- De Luca, A., Caraveo, P. A., Mereghetti, S., Negroni, M., & Bignami, G. F. 2005, ApJ, 623, 1051 [NASA ADS] [CrossRef] [Google Scholar]
- den Herder, J. W., Brinkman, A. C., Kahn, S. M., et al. 2001, A&A, 365, L7 [NASA ADS] [CrossRef] [EDP Sciences] [Google Scholar]
- Deneva, J. S., Cordes, J. M., & Lazio, T. J. W. 2009, ApJ, 702, L177 [NASA ADS] [CrossRef] [Google Scholar]
- Dickey, J. M., & Lockman, F. J. 1990, ARA&A, 28, 215 [NASA ADS] [CrossRef] [MathSciNet] [Google Scholar]
- Gotthelf, E. V., & Halpern, J. P. 2010, BAAS, 42, 694 [NASA ADS] [Google Scholar]
- Gotthelf, E. V., Perna, R., & Halpern, J. P. 2010, ApJ, 724, 1316 [NASA ADS] [CrossRef] [Google Scholar]
- Haberl, F. 2007, Ap&SS, 308, 181 [NASA ADS] [CrossRef] [Google Scholar]
- Haberl, F., & Zavlin, V. E. 2002, A&A, 391, 571 [NASA ADS] [CrossRef] [EDP Sciences] [Google Scholar]
- Haberl, F., Motch, C., Buckley, D. A. H., Zickgraf, F.-J., & Pietsch, W. 1997, A&A, 326, 662 [NASA ADS] [Google Scholar]
- Haberl, F., Schwope, A. D., Hambaryan, V., Hasinger, G., & Motch, C. 2003, A&A, 403, L19 [NASA ADS] [CrossRef] [EDP Sciences] [Google Scholar]
- Haberl, F., Motch, C., Zavlin, V. E., et al. 2004a, A&A, 424, 635 [NASA ADS] [CrossRef] [EDP Sciences] [Google Scholar]
- Haberl, F., Zavlin, V. E., Trümper, J., & Burwitz, V. 2004b, A&A, 419, 1077 [NASA ADS] [CrossRef] [EDP Sciences] [Google Scholar]
- Halpern, J. P., & Gotthelf, E. V. 2010, ApJ, 709, 436 [NASA ADS] [CrossRef] [Google Scholar]
- Hambaryan, V., Neuhäuser, R., Haberl, F., Hohle, M. M., & Schwope, A. D. 2009, A&A, 497, L9 [NASA ADS] [CrossRef] [EDP Sciences] [Google Scholar]
- Hambaryan, V., Suleimanov, V., Schwope, A. D., et al. 2011, A&A, 534, A74 [NASA ADS] [CrossRef] [EDP Sciences] [Google Scholar]
- Harding, A. K. 2013, Frontiers of Physics, 8, 679 [Google Scholar]
- Hewish, A., Bell, S. J., Pilkington, J. D., Scott, P. F., & Collins, R. A. 1968, Nature, 217, 709 [NASA ADS] [CrossRef] [Google Scholar]
- Hohle, M. M., Haberl, F., Vink, J., de Vries, C. P., & Neuhäuser, R. 2012a, MNRAS, 419, 1525 [NASA ADS] [CrossRef] [Google Scholar]
- Hohle, M. M., Haberl, F., Vink, J., et al. 2012b, MNRAS, 423, 1194 [NASA ADS] [CrossRef] [Google Scholar]
- Jansen, F., Lumb, D., Altieri, B., et al. 2001, A&A, 365, L1 [NASA ADS] [CrossRef] [EDP Sciences] [Google Scholar]
- Kaplan, D. L. 2008, in 40 Years of Pulsars: Millisecond Pulsars, Magnetars and More, eds. C. Bassa, Z. Wang, A. Cumming, & V. M. Kaspi, AIP Conf. Ser., 983, 331 [Google Scholar]
- Kaplan, D. L., & van Kerkwijk, M. H. 2005a, ApJ, 628, L45 [NASA ADS] [CrossRef] [Google Scholar]
- Kaplan, D. L., & van Kerkwijk, M. H. 2005b, ApJ, 635, L65 [NASA ADS] [CrossRef] [Google Scholar]
- Kaplan, D. L., & van Kerkwijk, M. H. 2009a, ApJ, 705, 798 [NASA ADS] [CrossRef] [Google Scholar]
- Kaplan, D. L., & van Kerkwijk, M. H. 2009b, ApJ, 692, L62 [NASA ADS] [CrossRef] [Google Scholar]
- Kaplan, D. L., & van Kerkwijk, M. H. 2011, ApJ, 740, L30 [NASA ADS] [CrossRef] [Google Scholar]
- Kaplan, D. L., van Kerkwijk, M. H., & Anderson, J. 2002, ApJ, 571, 447 [NASA ADS] [CrossRef] [Google Scholar]
- Kaplan, D. L., Kulkarni, S. R., & van Kerkwijk, M. H. 2003, ApJ, 588, L33 [NASA ADS] [CrossRef] [Google Scholar]
- Kaplan, D. L., van Kerkwijk, M. H., & Anderson, J. 2007, ApJ, 660, 1428 [NASA ADS] [CrossRef] [Google Scholar]
- Kaplan, D. L., Esposito, P., Chatterjee, S., et al. 2009, MNRAS, 400, 1445 [NASA ADS] [CrossRef] [Google Scholar]
- Kaplan, D. L., Kamble, A., van Kerkwijk, M. H., & Ho, W. C. G. 2011, ApJ, 736, 117 [NASA ADS] [CrossRef] [Google Scholar]
- Kaspi, V. M. 2010, Proc. Nat. Acad. Sci., 107, 7147 [Google Scholar]
- Keane, E. F., & McLaughlin, M. A. 2011, Bull. Astron. Soc. India, 39, 333 [NASA ADS] [Google Scholar]
- Keane, E. F., Kramer, M., Lyne, A. G., Stappers, B. W., & McLaughlin, M. A. 2011, MNRAS, 415, 3065 [NASA ADS] [CrossRef] [Google Scholar]
- Lai, D. 2001, Rev. Mod. Phys., 73, 629 [NASA ADS] [CrossRef] [Google Scholar]
- Lasker, B. M., Lattanzi, M. G., McLean, B. J., et al. 2008, AJ, 136, 735 [NASA ADS] [CrossRef] [PubMed] [Google Scholar]
- Lyne, A. G., McLaughlin, M. A., Keane, E. F., et al. 2009, MNRAS, 400, 1439 [NASA ADS] [CrossRef] [Google Scholar]
- Manchester, R. N., Hobbs, G. B., Teoh, A., & Hobbs, M. 2005, AJ, 129, 1993 [NASA ADS] [CrossRef] [Google Scholar]
- McLaughlin, M. 2009, Astrophys. Space Sci. Lib., 357, 41 [NASA ADS] [CrossRef] [Google Scholar]
- McLaughlin, M. A., Lyne, A. G., Lorimer, D. R., et al. 2006, Nature, 439, 817 [NASA ADS] [CrossRef] [PubMed] [Google Scholar]
- McLaughlin, M. A., Rea, N., Gaensler, B. M., et al. 2007, ApJ, 670, 1307 [NASA ADS] [CrossRef] [Google Scholar]
- Medin, Z., Lai, D., & Potekhin, A. Y. 2008, MNRAS, 383, 161 [NASA ADS] [CrossRef] [Google Scholar]
- Mereghetti, S. 2008, A&ARv, 15, 225 [NASA ADS] [CrossRef] [Google Scholar]
- Mereghetti, S. 2011, in High-Energy Emission from Pulsars and their Systems, eds. D. F. Torres, & N. Rea, 345 [Google Scholar]
- Mignani, R. P., Van de Putte, D., Cropper, M., et al. 2013, MNRAS, 429, 3517 [NASA ADS] [CrossRef] [Google Scholar]
- Mori, K., Chonko, J. C., & Hailey, C. J. 2005, ApJ, 631, 1082 [NASA ADS] [CrossRef] [Google Scholar]
- Motch, C., Haberl, F., Zickgraf, F.-J., Hasinger, G., & Schwope, A. D. 1999, A&A, 351, 177 [NASA ADS] [Google Scholar]
- Motch, C., Zavlin, V. E., & Haberl, F. 2003, A&A, 408, 323 [NASA ADS] [CrossRef] [EDP Sciences] [Google Scholar]
- Motch, C., Sekiguchi, K., Haberl, F., et al. 2005, A&A, 429, 257 [NASA ADS] [CrossRef] [EDP Sciences] [Google Scholar]
- Motch, C., Pires, A. M., Haberl, F., Schwope, A., & Zavlin, V. E. 2009, A&A, 497, 423 [NASA ADS] [CrossRef] [EDP Sciences] [Google Scholar]
- Pavlov, G. G., Zavlin, V. E., & Trümper, J. 1999, ApJ, 511, L45 [NASA ADS] [CrossRef] [Google Scholar]
- Pires, A. M., Motch, C., Turolla, R., et al. 2012, A&A, 544, A17 [NASA ADS] [CrossRef] [EDP Sciences] [Google Scholar]
- Pons, J. A., Miralles, J. A., & Geppert, U. 2009, A&A, 496, 207 [NASA ADS] [CrossRef] [EDP Sciences] [Google Scholar]
- Popov, S. B., Colpi, M., Prokhorov, M. E., Treves, A., & Turolla, R. 2003, A&A, 406, 111 [NASA ADS] [CrossRef] [EDP Sciences] [Google Scholar]
- Popov, S. B., Pons, J. A., Miralles, J. A., Boldin, P. A., & Posselt, B. 2010, MNRAS, 401, 2675 [NASA ADS] [CrossRef] [Google Scholar]
- Posselt, B., Popov, S. B., Haberl, F., et al. 2007, Ap&SS, 308, 171 [NASA ADS] [CrossRef] [Google Scholar]
- Posselt, B., Popov, S. B., Haberl, F., et al. 2008, A&A, 482, 617 [NASA ADS] [CrossRef] [EDP Sciences] [Google Scholar]
- Potekhin, A. Y. 1998, J. Phys. B Atomic Mol. Phys., 31, 49 [Google Scholar]
- Rea, N., & McLaughlin, M. 2008, in Astrophysics of Compact Objects, eds. Y.-F. Yuan, X.-D. Li, & D. Lai, AIP Conf. Ser. 968, 151 [Google Scholar]
- Rea, N., Curto, G. L., Testa, V., et al. 2010, MNRAS, 407, 1887 [NASA ADS] [CrossRef] [Google Scholar]
- Sanwal, D., Pavlov, G. G., Zavlin, V. E., & Teter, M. A. 2002, ApJ, 574, L61 [NASA ADS] [CrossRef] [Google Scholar]
- Sartore, N., Tiengo, A., Mereghetti, S., et al. 2012, A&A, 541, A66 [NASA ADS] [CrossRef] [EDP Sciences] [Google Scholar]
- Schwope, A., Hasinger, G., Lehmann, I., et al. 2000, Astron. Nachr., 321, 1 [NASA ADS] [CrossRef] [Google Scholar]
- Schwope, A. D., Hambaryan, V., Haberl, F., & Motch, C. 2005, A&A, 441, 597 [NASA ADS] [CrossRef] [EDP Sciences] [Google Scholar]
- Schwope, A. D., Hambaryan, V., Haberl, F., & Motch, C. 2007, Ap&SS, 308, 619 [NASA ADS] [CrossRef] [Google Scholar]
- Shabaltas, N., & Lai, D. 2012, ApJ, 748, 148 [NASA ADS] [CrossRef] [Google Scholar]
- Strüder, L., Briel, U., Dennerl, K., et al. 2001, A&A, 365, L18 [NASA ADS] [CrossRef] [EDP Sciences] [Google Scholar]
- Suleimanov, V. F., Pavlov, G. G., & Werner, K. 2010, ApJ, 714, 630 [NASA ADS] [CrossRef] [Google Scholar]
- Tetzlaff, N., Eisenbeiss, T., Neuhäuser, R., & Hohle, M. M. 2011, MNRAS, 417, 617 [NASA ADS] [CrossRef] [Google Scholar]
- Tetzlaff, N., Schmidt, J. G., Hohle, M. M., & Neuhäuser, R. 2012, PASA, 29, 98 [NASA ADS] [CrossRef] [Google Scholar]
- Tiengo, A., & Mereghetti, S. 2007, ApJ, 657, L101 [NASA ADS] [CrossRef] [Google Scholar]
- Turner, M. J. L., Abbey, A., Arnaud, M., et al. 2001, A&A, 365, L27 [NASA ADS] [CrossRef] [EDP Sciences] [Google Scholar]
- Turolla, R. 2009, Astrophys. Space Sci. Lib., 357, 141 [NASA ADS] [CrossRef] [Google Scholar]
- Turolla, R., Zane, S., Pons, J. A., Esposito, P., & Rea, N. 2011, ApJ, 740, 105 [NASA ADS] [CrossRef] [Google Scholar]
- van Kerkwijk, M. H., & Kaplan, D. L. 2007, Ap&SS, 308, 191 [NASA ADS] [CrossRef] [Google Scholar]
- van Kerkwijk, M. H., & Kaplan, D. L. 2008, ApJ, 673, L163 [NASA ADS] [CrossRef] [Google Scholar]
- van Kerkwijk, M. H., Kaplan, D. L., Durant, M., Kulkarni, S. R., & Paerels, F. 2004, ApJ, 608, 432 [NASA ADS] [CrossRef] [Google Scholar]
- Viganò, D., Pons, J. A., & Miralles, J. A. 2012, Comp. Phys. Comm., 183, 2042 [Google Scholar]
- Viganò, D., Rea, N., Pons, J. A., et al. 2013, MNRAS, 434, 123 [NASA ADS] [CrossRef] [Google Scholar]
- Walter, F. M. 2001, ApJ, 549, 433 [NASA ADS] [CrossRef] [Google Scholar]
- Walter, F. M., Eisenbeiß, T., Lattimer, J. M., et al. 2010, ApJ, 724, 669 [NASA ADS] [CrossRef] [Google Scholar]
- Weisskopf, M. C., Brinkman, B., Canizares, C., et al. 2002, PASP, 114, 1 [NASA ADS] [CrossRef] [Google Scholar]
- Wilms, J., Allen, A., & McCray, R. 2000, ApJ, 542, 914 [NASA ADS] [CrossRef] [Google Scholar]
- Yakovlev, D. G., & Pethick, C. J. 2004, ARA&A, 42, 169 [NASA ADS] [CrossRef] [EDP Sciences] [MathSciNet] [Google Scholar]
- Zane, S., & Turolla, R. 2006, MNRAS, 366, 727 [NASA ADS] [CrossRef] [Google Scholar]
- Zane, S., Turolla, R., Stella, L., & Treves, A. 2001, ApJ, 560, 384 [NASA ADS] [CrossRef] [Google Scholar]
- Zane, S., Turolla, R., & Drake, J. J. 2004, Adv. Space Res., 33, 531 [Google Scholar]
- Zane, S., Cropper, M., Turolla, R., et al. 2005, ApJ, 627, 397 [NASA ADS] [CrossRef] [Google Scholar]
- Zane, S., de Luca, A., Mignani, R. P., & Turolla, R. 2006, A&A, 457, 619 [NASA ADS] [CrossRef] [EDP Sciences] [Google Scholar]
- Zane, S., Haberl, F., Israel, G. L., et al. 2011, MNRAS, 410, 2428 [NASA ADS] [CrossRef] [Google Scholar]
All Tables
Instrumental configuration and duration of the EPIC and RGS scientific exposures of the XMM-Newton AO11 observation of RX J1605.3+3249.
Parameters of RX J1605.3+3249, as extracted from the AO11 XMM-Newton EPIC observations.
Summary of XMM-Newton observations of RX J1605.3+3249 used in the spectral analysis.
All Figures
|
Fig. 1 Results of the |
| In the text | |
|
Fig. 2 Background-subtracted light curve for pn, folded at the spin period P ~ 3.39 s. Two cycles are shown for clarity. The energy band is 0.5 − 1.69 keV and the size of the extraction region is 9′′. A best-fit sinusoidal curve to the folded light curve is superposed in dashed line. |
| In the text | |
|
Fig. 3 Best-fit blackbody temperature of RX J1605.3+3249 in each observation and XMM-Newton detector of Table 3 (see caption). Errors are 1σ. |
| In the text | |
|
Fig. 4 Results of spectral fitting of source J1605 (EPIC). We show the combined EPIC spectra and folded best-fit models, with residuals. Top left: simple blackbody model. Top right: double blackbody model. Bottom left: double blackbody model with one Gaussian absorption line. Bottom right: double blackbody model with two Gaussian absorption lines. |
| In the text | |
|
Fig. 5 Best-fit spectral parameters of RX J1605.3+3249. Data points are results from fitting the MOS and pn spectra from the XMM-Newton observations in Table 3. The spectral model corresponds to a double blackbody with two Gaussian absorption features (model (6) in Table 4). We show the best-fit temperature of the cool and hot blackbody components (left), as well as the best-fit line energies (right). Errors represent 1σ confidence level. Solid horizontal lines show results for the fit of the combined EPIC spectrum (1σ errors are displayed as dashed lines). |
| In the text | |
|
Fig. 6 P − Ṗ diagram highlighting the position of peculiar groups of isolated neutron stars (see legend). The tentative location of the M7 neutron star RX J1605.3+3249 is labelled, as that of the only rotating radio transient (RRAT) so far detected in X-rays, RRAT J1819-1458. |
| In the text | |
Current usage metrics show cumulative count of Article Views (full-text article views including HTML views, PDF and ePub downloads, according to the available data) and Abstracts Views on Vision4Press platform.
Data correspond to usage on the plateform after 2015. The current usage metrics is available 48-96 hours after online publication and is updated daily on week days.
Initial download of the metrics may take a while.