Free Access
Fig. 7
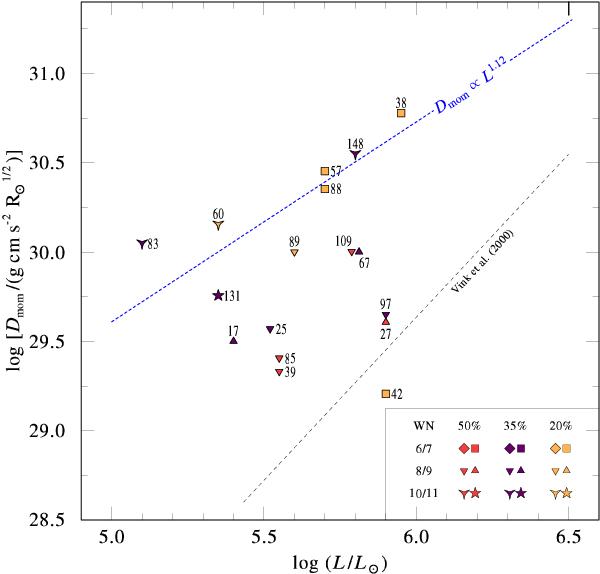
Modified wind momentum Dmom for the analyzed WN stars, plotted against their luminosities. The blue dotted line shows the least square fit for the stars with XH ≤ 0.2. For comparison, the relation from Vink et al. (2000) for O-stars (black dashed line) is also shown.
Current usage metrics show cumulative count of Article Views (full-text article views including HTML views, PDF and ePub downloads, according to the available data) and Abstracts Views on Vision4Press platform.
Data correspond to usage on the plateform after 2015. The current usage metrics is available 48-96 hours after online publication and is updated daily on week days.
Initial download of the metrics may take a while.