Fig. 6
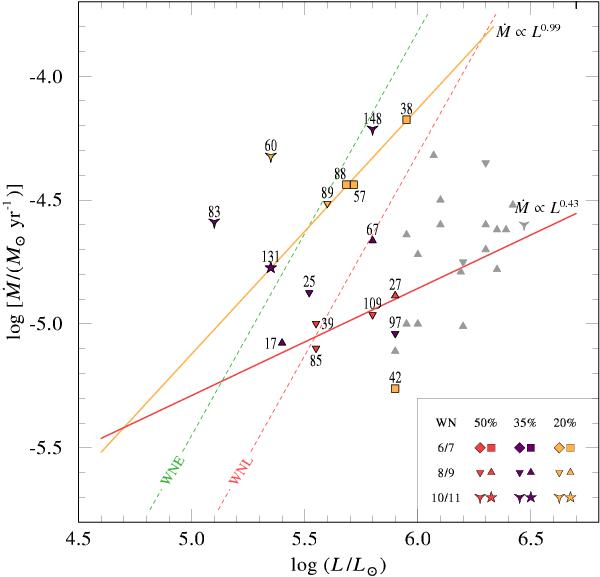
Empirical mass-loss rate versus luminosity for the M 31 late-type WN star sample. The thick lines show the least square fits for the stars with XH ≈ 0.2 and XH ≈ 0.5, respectively. For comparison, the relations from Nugis & Lamers (2000) are also shown as dashed lines. The gray symbols are the late-type WN stars near the Galactic center from Martins et al. (2008); Liermann et al. (2010) and Oskinova et al. (2013).
Current usage metrics show cumulative count of Article Views (full-text article views including HTML views, PDF and ePub downloads, according to the available data) and Abstracts Views on Vision4Press platform.
Data correspond to usage on the plateform after 2015. The current usage metrics is available 48-96 hours after online publication and is updated daily on week days.
Initial download of the metrics may take a while.