Fig. 11
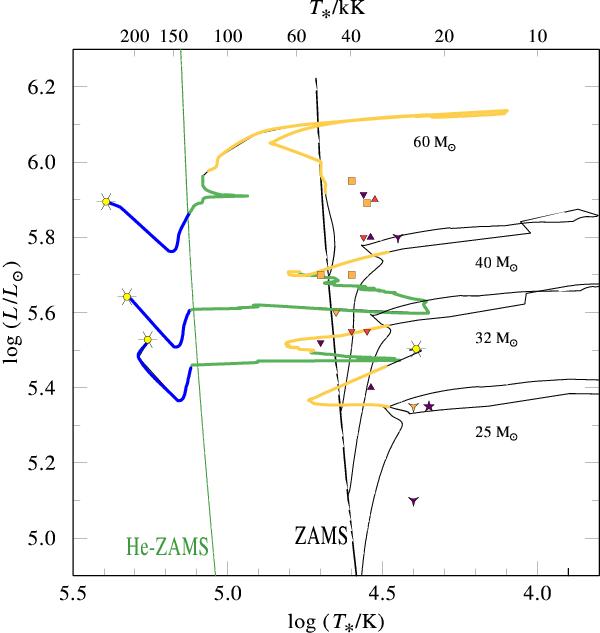
HR diagram of the M 31 late WN sample compared with the latest set of Geneva evolutionary tracks for Z = 0.014 (with rotation) from Georgy et al. (2012). The thick orange part of the tracks corresponds to the hydrogen-rich WN phase, while the green and the blue parts indicate the hydrogen-free WN and the WC (incl. WO) phase, respectively.
Current usage metrics show cumulative count of Article Views (full-text article views including HTML views, PDF and ePub downloads, according to the available data) and Abstracts Views on Vision4Press platform.
Data correspond to usage on the plateform after 2015. The current usage metrics is available 48-96 hours after online publication and is updated daily on week days.
Initial download of the metrics may take a while.