Fig. 9
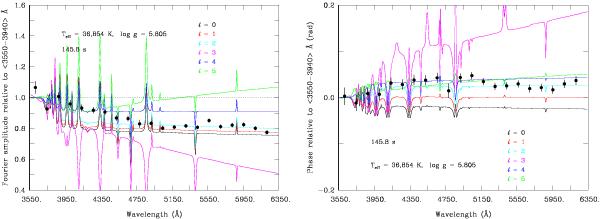
Left: observed relative amplitude behaviour as a function of wavelength for P2 = 145.8 s, depicted by the black points with error bars. Each point represents a 130 Å wide bin of the original monochromatic quantity, which was averaged in order to improve the S/N. The error bars indicate the rms deviation about the average value within the wavelength bin. The predicted monochromatic amplitudes for different degree indices are also shown and labelled. All quantities have been normalised. Right: similar to the left panel, but referring to the relative phase.
Current usage metrics show cumulative count of Article Views (full-text article views including HTML views, PDF and ePub downloads, according to the available data) and Abstracts Views on Vision4Press platform.
Data correspond to usage on the plateform after 2015. The current usage metrics is available 48-96 hours after online publication and is updated daily on week days.
Initial download of the metrics may take a while.