Free Access
Fig. 7
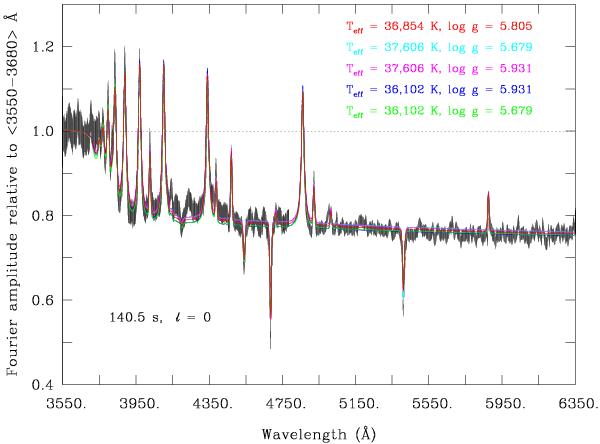
Normalised observed amplitude for P1 (black curve together with error bars for 1867 data points) compared with theoretical monochromatic amplitudes (five curves of different colours depicting the ℓ = 0 solution for our reference model and for four additional models spanning 2σ in the log g-Teff plane).
Current usage metrics show cumulative count of Article Views (full-text article views including HTML views, PDF and ePub downloads, according to the available data) and Abstracts Views on Vision4Press platform.
Data correspond to usage on the plateform after 2015. The current usage metrics is available 48-96 hours after online publication and is updated daily on week days.
Initial download of the metrics may take a while.