Fig. 6
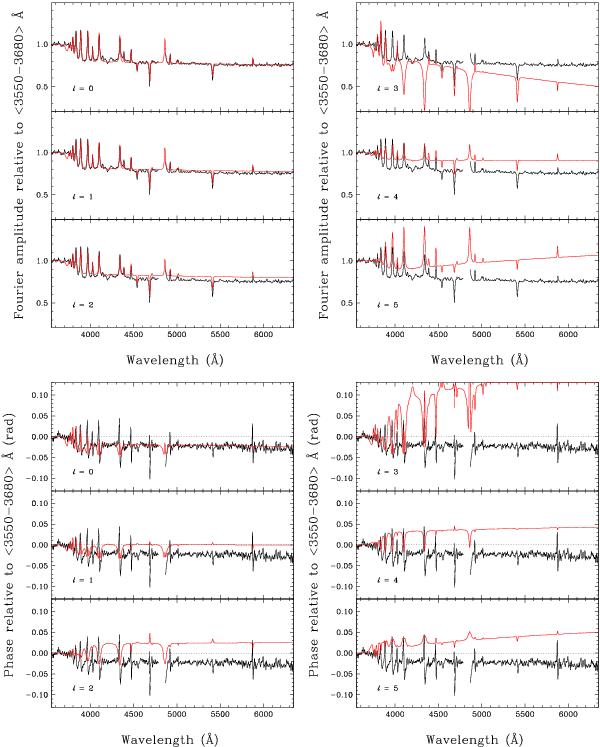
Top blocks: normalised observed amplitude for P1 (black curve) together with the theoretical monochromatic amplitudes (red curves) as calculated for a period P = 140.5 s and the atmospheric parameters determined for EC 01541−1409 for modes with degree of ℓ = 0−5 as indicated in the individual panels. Bottom blocks: the corresponding plots for the normalised monochromatic phase. Velocity fields were not included in our continuum phase calculations, which is why the observed phase jumps across spectral lines are not recovered by the models.
Current usage metrics show cumulative count of Article Views (full-text article views including HTML views, PDF and ePub downloads, according to the available data) and Abstracts Views on Vision4Press platform.
Data correspond to usage on the plateform after 2015. The current usage metrics is available 48-96 hours after online publication and is updated daily on week days.
Initial download of the metrics may take a while.