Fig. 4
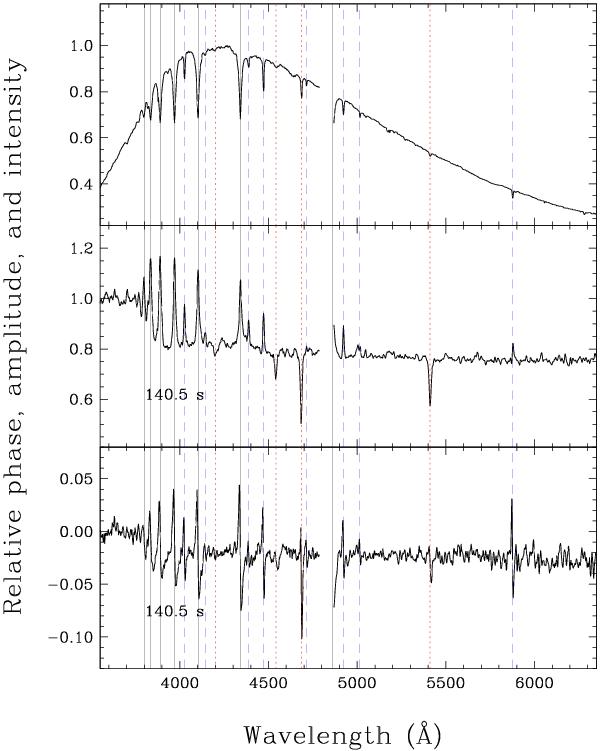
Flux obtained from the combined time-averaged spectrum gathered for EC 01541−1409 across the two FORS chips (top panel) together with the wavelength-dependent amplitude (middle panel) and phase (bottom panel) extracted for the dominant 140.5 s mode. The flux and the amplitude spectra have been normalised to unity and are consequently dimensionless quantities, while the phase is plotted relative to its average value in the blue part of the spectrum in radians. The spectral lines identified are marked by vertical lines propagating across all plots: black continuous lines indicate hydrogen Balmer lines, dashed blue lines denote He I lines, and dotted red lines show He II lines.
Current usage metrics show cumulative count of Article Views (full-text article views including HTML views, PDF and ePub downloads, according to the available data) and Abstracts Views on Vision4Press platform.
Data correspond to usage on the plateform after 2015. The current usage metrics is available 48-96 hours after online publication and is updated daily on week days.
Initial download of the metrics may take a while.