Fig. 12
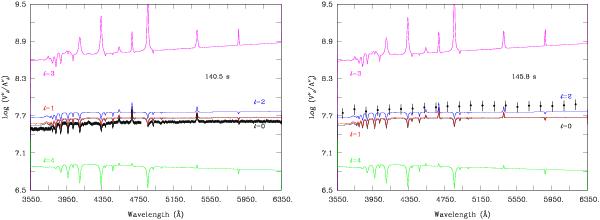
Left: observed monochromatic velocity-to-amplitude ratio (1867 data points with error bars superimposed on the heavy black curve) as a function of wavelength for P1 = 140.5 s. The predicted monochromatic ratios for different degree indices are also shown and labelled. The cgs unit convention is used for the y-axis. Right: similar to the left panel, but referring to the P2 mode with 21 wavelength bins.
Current usage metrics show cumulative count of Article Views (full-text article views including HTML views, PDF and ePub downloads, according to the available data) and Abstracts Views on Vision4Press platform.
Data correspond to usage on the plateform after 2015. The current usage metrics is available 48-96 hours after online publication and is updated daily on week days.
Initial download of the metrics may take a while.