Free Access
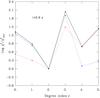
Fig. 11
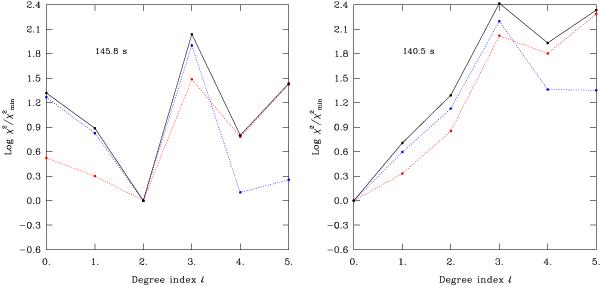
Left: relative χ2 values for the amplitude data alone (dotted red line), for the phase data alone (blue dotted line), and for the combination of amplitude and phase data (solid black line). Right: similar to the left panel, but referring to the dominant 140.5 s mode.
This figure is made of several images, please see below:
Current usage metrics show cumulative count of Article Views (full-text article views including HTML views, PDF and ePub downloads, according to the available data) and Abstracts Views on Vision4Press platform.
Data correspond to usage on the plateform after 2015. The current usage metrics is available 48-96 hours after online publication and is updated daily on week days.
Initial download of the metrics may take a while.