Fig. 7
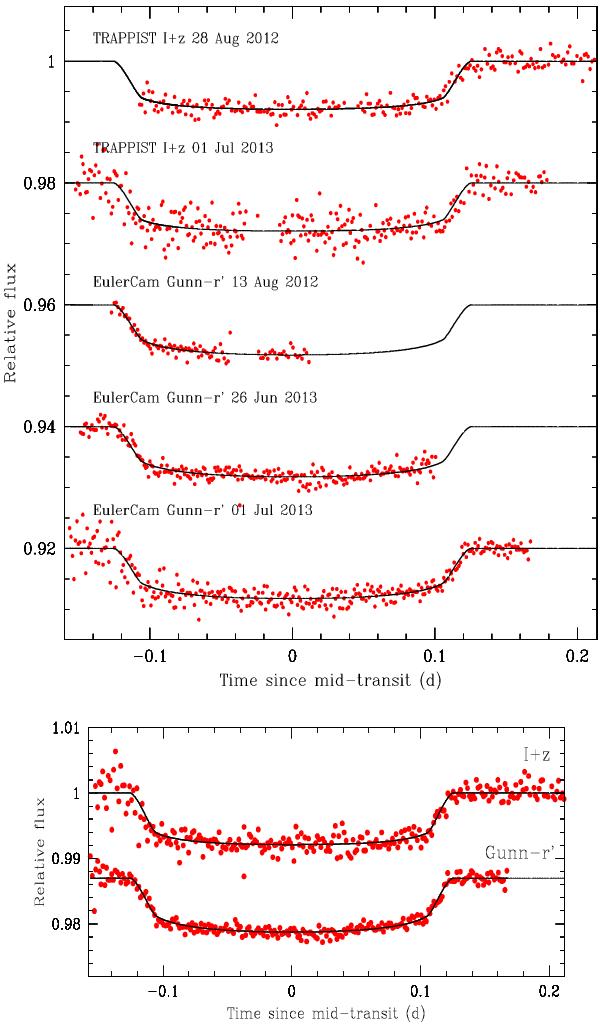
Top: individual follow-up transit light curves for WASP-88 b. Bottom: combined follow-up photometry for WASP-88 b. The observations are shown as red points (bin width =2min) and are period-folded on the best-fit transit ephemeris. Each light curve has been divided by the respective photometric baseline model (see Sect. 3.2). For each filter, the superimposed, solid black line is our best-fit transit model. The light curves are shifted along the y-axis for clarity.
Current usage metrics show cumulative count of Article Views (full-text article views including HTML views, PDF and ePub downloads, according to the available data) and Abstracts Views on Vision4Press platform.
Data correspond to usage on the plateform after 2015. The current usage metrics is available 48-96 hours after online publication and is updated daily on week days.
Initial download of the metrics may take a while.