Fig. 8
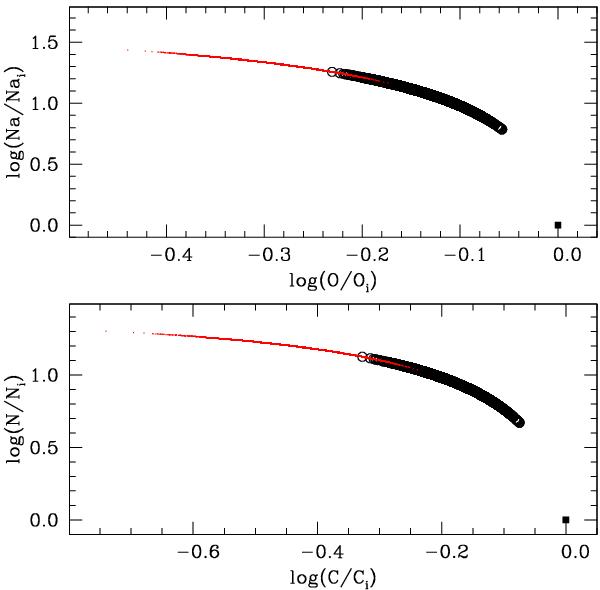
C-N (upper panel) and O-Na (lower panel) anticorrelations (abundances are given as the logarithm of the ratio between the final and initial values) predicted by our simulations for the case with Yaccr = 0.44 (see text for details). Red dots and black circles correspond to bMS and mMS objects, respectively. The filled squares displays the abundance ratios on the rMS.
Current usage metrics show cumulative count of Article Views (full-text article views including HTML views, PDF and ePub downloads, according to the available data) and Abstracts Views on Vision4Press platform.
Data correspond to usage on the plateform after 2015. The current usage metrics is available 48-96 hours after online publication and is updated daily on week days.
Initial download of the metrics may take a while.