Free Access
Fig. 3
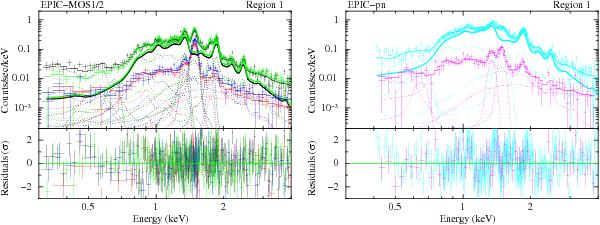
EPIC spectra of region 1 (MOS1: black, MOS2: green, pn: cyan) and the background region (MOS1: red, MOS2: blue, pn: magenta) and the best-fit model. The thick solid lines show the source emission component (VNEI). The dotted lines show all the other components included in the model.
This figure is made of several images, please see below:
Current usage metrics show cumulative count of Article Views (full-text article views including HTML views, PDF and ePub downloads, according to the available data) and Abstracts Views on Vision4Press platform.
Data correspond to usage on the plateform after 2015. The current usage metrics is available 48-96 hours after online publication and is updated daily on week days.
Initial download of the metrics may take a while.