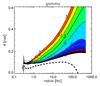
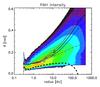
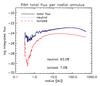
Fig. 7
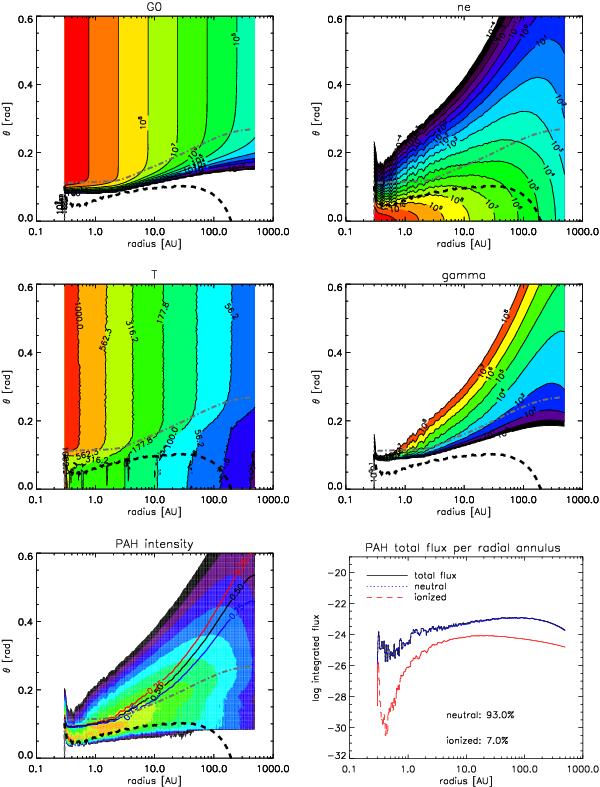
Diagnostic plots of benchmark model. The dashed black line is the vertical τMIR = 1 surface at 10 μm, the dash-dotted grey line gives the radial τUV = 1 surface at 0.1 μm. Upper left: strength of the UV field G0. Upper right: electron number density ne. Middle left: temperature distribution in the disk. Middle right: ionization parameter γ given by G0T1/2/ne. Bottom left: PAH intensity of a 2D cut through the disk. This diagnostic plot shows the origin of the PAH flux in the disk, i.e. the contributions of PAH emission to the final spectrum. The intensity of the PAH flux is shown in logarithmic scale (arbitrary scaling), where each color spans an order of magnitude. The solid red, black and blue lines give the locations where the neutral fractions f(0) are respectively 0.25, 0.5, 0.75. The neutral fractions are computed by Eqs. (4) and (5) in each grid cell of the disk. PAHs in the surface of the disk are largely ionized, while PAHs in the mid-plane are neutral. Bottom right: intensity of PAH emission per radial annulus (arbitrary units). The blue and red lines give the neutral and ionized contributions. 93% of the PAH molecules in the benchmark flaring disk model are neutral. The contribution from neutral PAHs dominate irrespective of the radial location in the disk. The noise is due to photon statistics. The height θ relates to Z by, θ = tan (Z/r).
Current usage metrics show cumulative count of Article Views (full-text article views including HTML views, PDF and ePub downloads, according to the available data) and Abstracts Views on Vision4Press platform.
Data correspond to usage on the plateform after 2015. The current usage metrics is available 48-96 hours after online publication and is updated daily on week days.
Initial download of the metrics may take a while.