Fig. 11
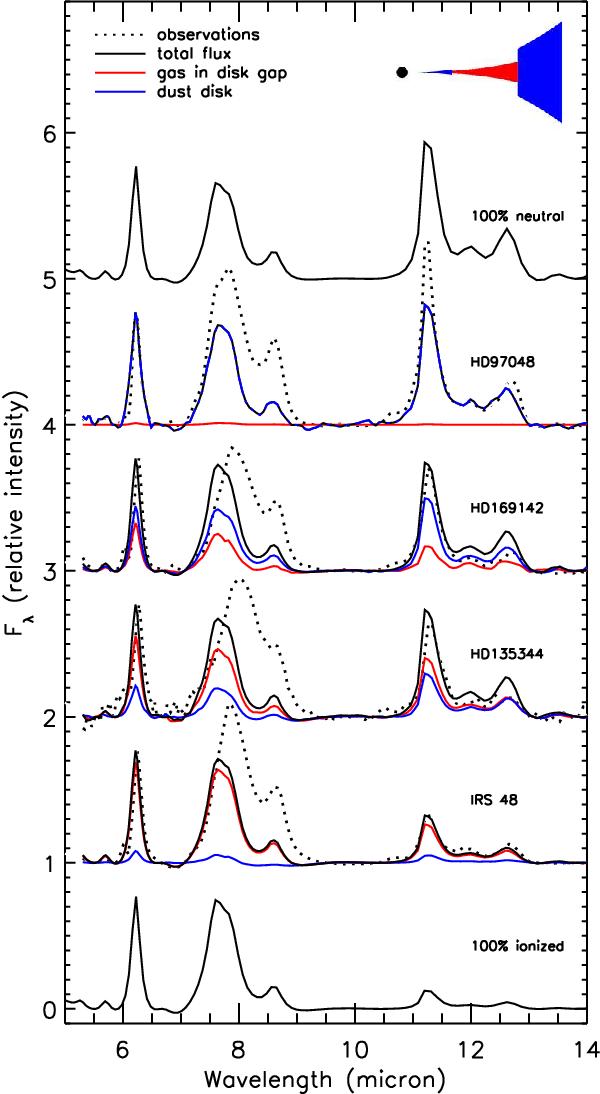
Top and bottom spectra represent the benchmark models with respectively 100% neutral and 100% ionized PAHs. The middle four spectra show transitional disks with the dotted black line showing the Spitzer observations, the solid black lines the total fluxes of the best fit models, the solid blue line the contribution from PAHs in the dust disk, and the solid red line the contribution from the low density optically thin disk. Note that for HD 97048, there is no low density optically thin disk component thus the solid black and blue lines are merged into a dashed blue-black line. For Oph IRS 48, the spectrum is dominated by ionized PAHs from the low density optically thin disk.
Current usage metrics show cumulative count of Article Views (full-text article views including HTML views, PDF and ePub downloads, according to the available data) and Abstracts Views on Vision4Press platform.
Data correspond to usage on the plateform after 2015. The current usage metrics is available 48-96 hours after online publication and is updated daily on week days.
Initial download of the metrics may take a while.