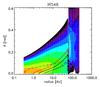
Fig. 10
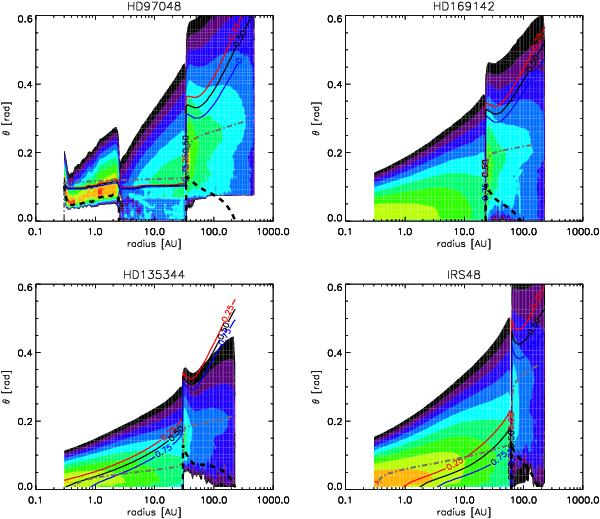
Diagnostic plots showing the origin of the PAH flux in the disk, i.e. the contributions of PAH emission to the final spectrum. The intensity of the PAH flux is shown in logarithmic scale (arbitrary scaling), where each color spans an order of magnitude. Top left: HD 97048, top right: HD 169142, bottom left: HD 135344 B, bottom right: Oph IRS 48. The red, black and blue solid lines give the locations where the neutral fractions f(0) are respectively 0.25, 0.5, 0.75. The neutral fractions are computed by Eqs. (4) and (5) in each grid cell of the disk. PAHs in the surface of the disk are largely ionized, while PAHs in the mid-plane are neutral. The dashed black line is the vertical τMIR = 1 surface at 10 μm, the dash-dotted grey line gives the radial τUV = 1 surface at 0.1 μm. The height θ relates to Z by, θ = tan (Z/r).
Current usage metrics show cumulative count of Article Views (full-text article views including HTML views, PDF and ePub downloads, according to the available data) and Abstracts Views on Vision4Press platform.
Data correspond to usage on the plateform after 2015. The current usage metrics is available 48-96 hours after online publication and is updated daily on week days.
Initial download of the metrics may take a while.