Fig. 2
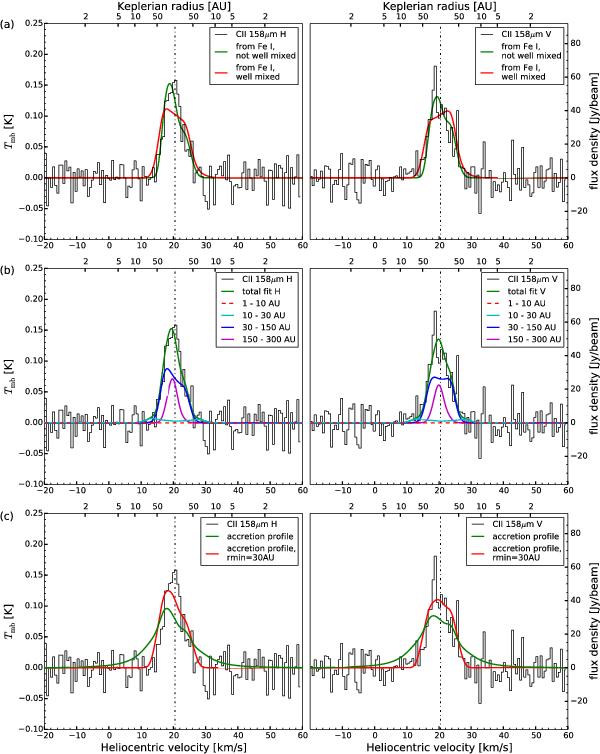
Herschel/HIFI spectra of the C ii 158 μm emission from the β Pic debris disk and different fits. The two columns show horizontal (H) and vertical (V) polarisation. The Keplerian radius r (related to the velocity axis by v = (GM∗r-1)0.5) is plotted on the upper x-axis of each data set. It corresponds to the largest radius where the corresponding projected velocity on the lower x-axis can be reached. If there is gas inside a certain Keplerian radius, we should see emission at the corresponding velocity (assuming a non-clumpy disk). The vertical dashed line indicates β Pic’s systematic velocity of 20.5 km s-1 (Brandeker 2011). For better visualisation the data have been rebinned to a bin size of 0.63 km s-1. The original data have a resolution of 0.17 km s-1. For all fits, we oversampled the data to bin sizes of 0.08 km s-1. Note that the difference between the fitted H and V beam profiles comes from the different positioning of the beams (Fig. 1). Panels a) compare the data with C ii profiles derived from observations of Fe i by Nilsson et al. (2012). Assuming a well mixed gas, a reasonable fit can be found. If the assumption is dropped, the fit can be improved. See text (Sect. 4.1) for more details. Panels b) show the best ring fit profile and the contribution of individual rings. Emission coming from the two inner rings is minor. Panels c) show the fitted profile for an accretion surface density, Σ ∝ r-1. It is difficult to bring this model into agreement with the observations, because the gas close to the star produces extended wings in the profile. A profile with the same underlying surface density, but truncated at 30 AU, gives a significantly better fit and demonstrates the problem.
Current usage metrics show cumulative count of Article Views (full-text article views including HTML views, PDF and ePub downloads, according to the available data) and Abstracts Views on Vision4Press platform.
Data correspond to usage on the plateform after 2015. The current usage metrics is available 48-96 hours after online publication and is updated daily on week days.
Initial download of the metrics may take a while.