Fig. 7
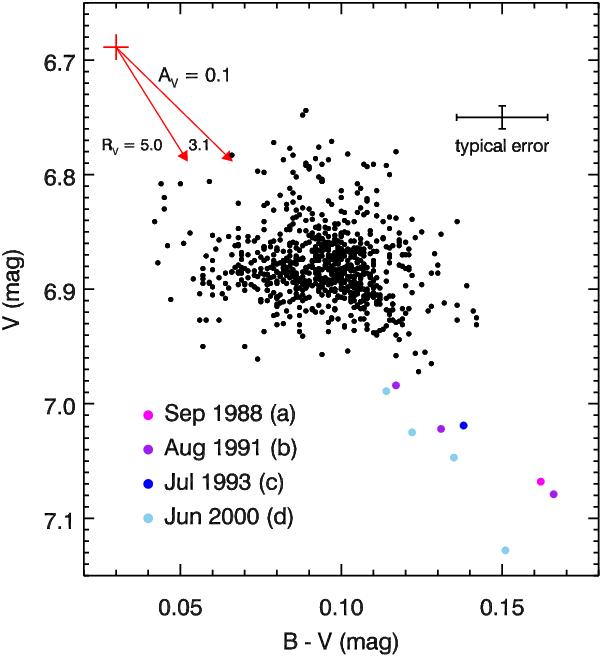
(B − V, V) color−magnitude diagram for HD 163296. Datapoints span the period 1983−2012; see Fig. 5 for the coverage of this epoch. Only points with errors <0.1 mag are plotted. Fading events in 1988, 1991, 1993, and 2000 (letters correspond to Fig. 5) are highlighted with colored symbols. During these events, the colors change along the extinction vector (Cardelli et al. 1989), which is plotted for RV = 3.1 and RV = 5.0. The origin of this vector, indicated with a red cross, represents the intrinsic colors and magnitude of an A1V star at 119 pc (Kenyon & Hartmann 1995).
Current usage metrics show cumulative count of Article Views (full-text article views including HTML views, PDF and ePub downloads, according to the available data) and Abstracts Views on Vision4Press platform.
Data correspond to usage on the plateform after 2015. The current usage metrics is available 48-96 hours after online publication and is updated daily on week days.
Initial download of the metrics may take a while.