Fig. 3
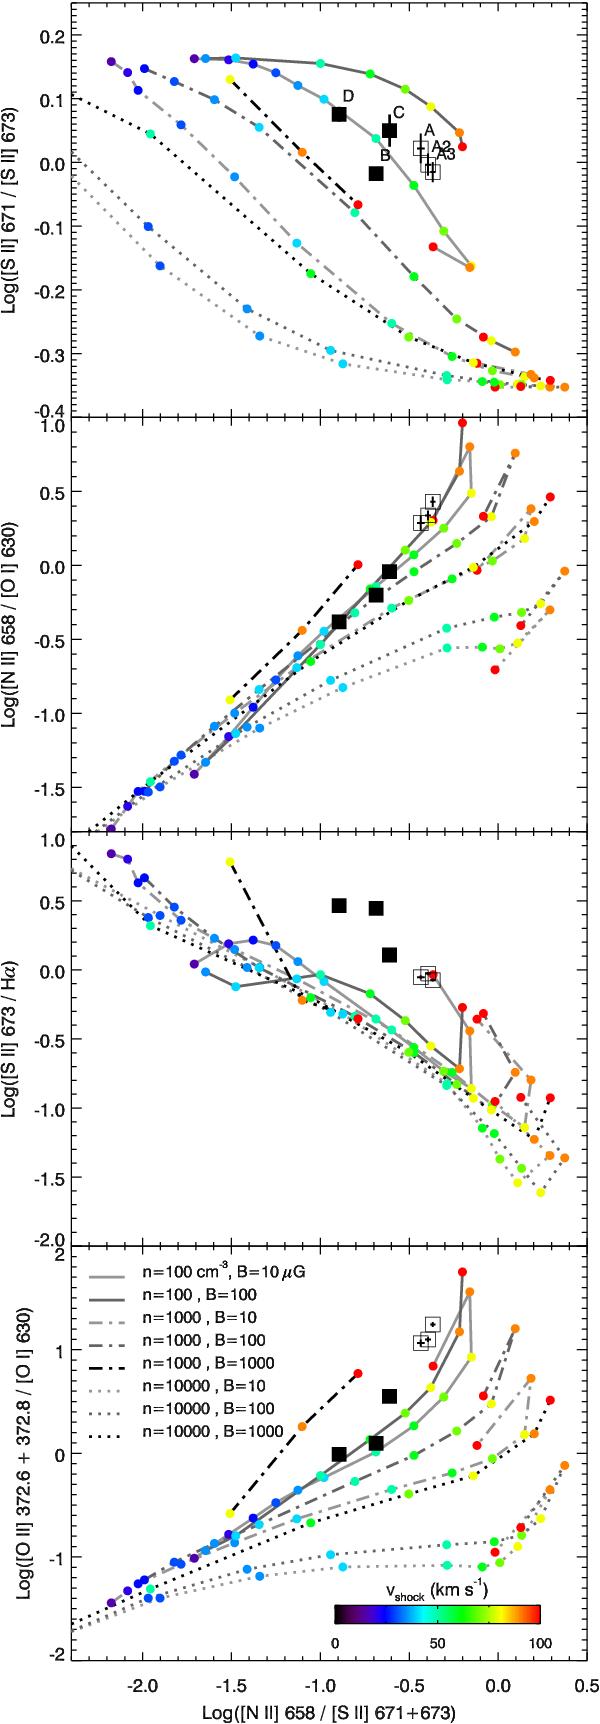
Emission line ratios for six knots in the blue (open symbols) and red (filled symbols) lobes. Contours indicate the predicted ratios by the models of Hartigan et al. (1994) for a grid of pre-shock densities, magnetic field strengths, and shock velocities. The colored symbols correspond to models with νshock = (15,20,25,30,35,40,50,60,70,80,90,100) km s-1.
Current usage metrics show cumulative count of Article Views (full-text article views including HTML views, PDF and ePub downloads, according to the available data) and Abstracts Views on Vision4Press platform.
Data correspond to usage on the plateform after 2015. The current usage metrics is available 48-96 hours after online publication and is updated daily on week days.
Initial download of the metrics may take a while.